
The SaaS industry in 2026 is no longer a growth story — it is a restructuring story. The global market has reached somewhere between $344 billion and $465 billion depending on the scope of measurement, organisations spend an average of $55.7 million on SaaS annually, and the average company runs 106 different SaaS applications. But beneath these headline numbers, a fundamental shift is underway: AI-native platforms are pulling away from traditional software at a speed that is reshaping pricing models, competitive dynamics, and how companies think about technology spending entirely.
What makes 2026 different from any previous year in SaaS is the bifurcation. AI-native SaaS companies are experiencing outsized growth — 38% compound annual growth rates in some segments — while traditional platforms face pricing pressure, commoditisation, and churn rates that would have been unthinkable five years ago. 62% of SaaS platforms have already introduced AI-premium pricing tiers. 80% of companies have deployed AI-enabled apps in their IT environments, up from just 5% in 2023. The speed of this transition has left many buyers struggling to manage costs and many sellers scrambling to integrate AI before their competitors make them irrelevant.
This guide compiles 60+ verified statistics from Statista, Gartner, Mordor Intelligence, and other authoritative sources to give you the most comprehensive, data-driven picture of the SaaS industry as it stands right now — whether you’re building a SaaS product, investing in one, buying one, or competing against one.
SaaS Market Size and Growth: The $465 Billion Landscape
The global SaaS market is projected to reach between $344 billion (Gartner’s narrower definition) and $465 billion (Precedence Research’s broader scope) in 2026, representing 18–19% year-over-year growth. The difference in estimates comes down to how you define the boundaries of SaaS — whether you include infrastructure-layer cloud services, vertical-specific platforms, and AI-native tools that blur the line between SaaS and AI.
Regardless of which figure you use, the trajectory is clear. Worldwide SaaS revenue is expected to maintain a 19.38% annual growth rate between 2025 and 2029, leading to a market volume of $793 billion by 2029 (Vena Solutions). The B2B SaaS segment specifically is estimated at $492.34 billion in 2026, growing toward an extraordinary $1.58 trillion by 2031 (Mordor Intelligence). Fortune Business Insights projects the global SaaS market will reach $1.48 trillion by 2034 from $375.57 billion in 2026.
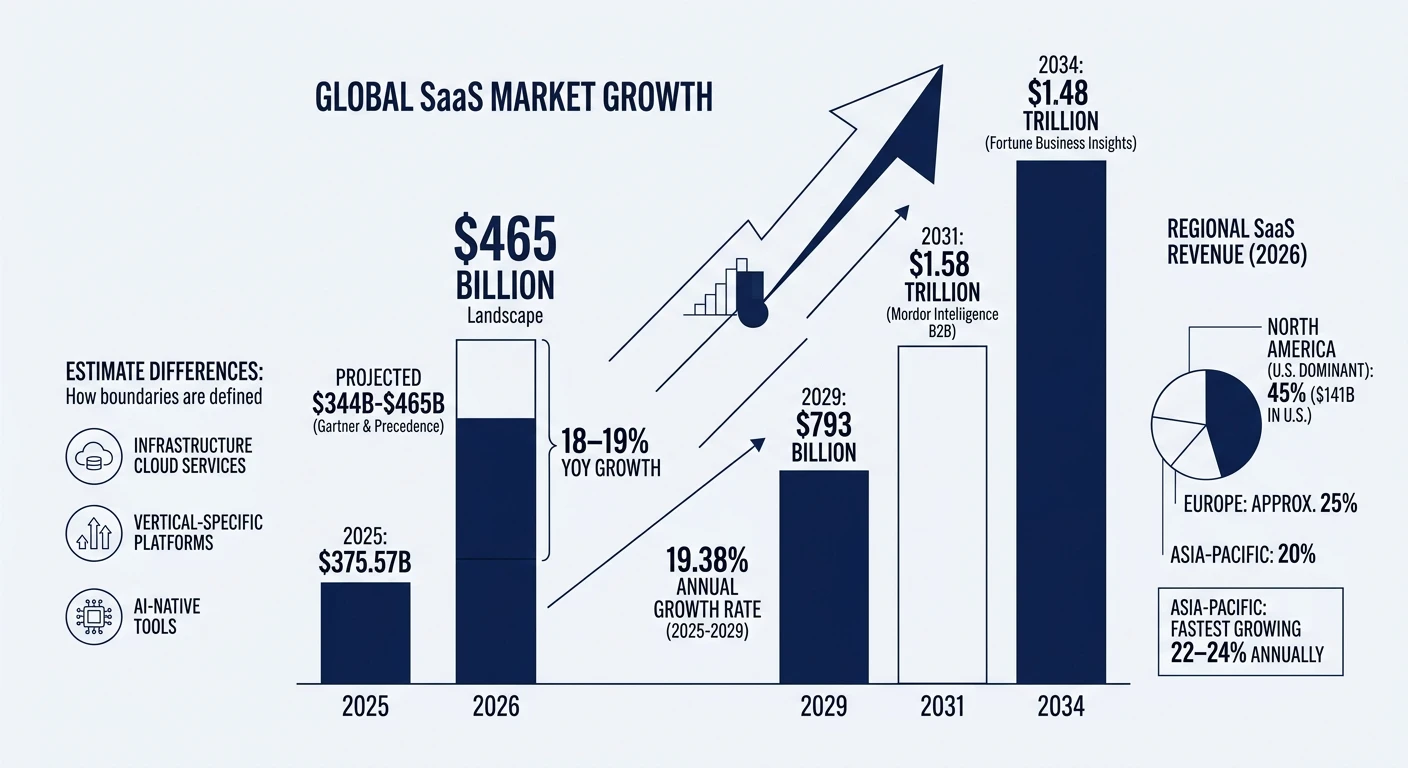
The United States remains the dominant market at $141 billion in 2026, driven by technological advancement, increasing demand for cloud-based solutions, and the ongoing digital transformation across every industry vertical. North America accounts for roughly 45% of global SaaS revenue, followed by Europe at approximately 25% and Asia-Pacific at 20% — though Asia-Pacific is growing the fastest at 22–24% annually.
Metric | Value | Source |
Global SaaS Market (2026, narrow) | ~$344B | Gartner |
Global SaaS Market (2026, broad) | ~$465B | Precedence Research |
US SaaS Market (2026) | $141B | Fortune Business Insights |
B2B SaaS Market (2026) | $492.34B | Mordor Intelligence |
Projected Global SaaS (2029) | $793B | Vena Solutions |
Projected Global SaaS (2034) | $1.48T | Fortune Business Insights |
B2B SaaS Projected (2031) | $1.58T | Mordor Intelligence |
CAGR (2025–2029) | 19.38% | Vena Solutions |
Average Annual SaaS Spend per Organisation | $55.7M | Zylo |
YoY Increase in SaaS Spending | 8% | Zylo |
What’s important to understand about these growth numbers is that the growth is not evenly distributed. AI-native SaaS companies are capturing a disproportionate share. Traditional SaaS companies that have not integrated meaningful AI capabilities are seeing slower growth, higher churn, and increasing pricing pressure from both AI-native competitors and their own customers who are consolidating their tech stacks.
How Many SaaS Companies Exist — And How Many Will Survive
The SaaS landscape has become enormous and intensely competitive. Estimates for the total number of SaaS companies worldwide range from 30,800 (Statista’s strict count) to over 42,000 (broader industry estimates that include vertical SaaS, micro-SaaS, and AI-native startups). Approximately 12,400–17,000 of those companies are based in the United States, reflecting the country’s outsized dominance in enterprise software.
The scale of competition means consolidation is inevitable. While the number of SaaS companies has grown, the average number of SaaS apps per company has actually plateaued — at 106 per organisation in 2024, down slightly from 112 in 2023 (BetterCloud). The consolidation rate dropped from 14% to just 5%, however, suggesting that while companies want to reduce app sprawl, the practical difficulty of migrating between platforms slows the process.
By 2026, 85% of business applications are expected to be SaaS-based, up from 70% currently (Colorlib). About 81% of organisations have automated at least one business process using SaaS applications. The market has reached a level of penetration where the question is no longer “should we use SaaS?” but “which of the 106 SaaS tools we’re already paying for can we eliminate or consolidate?”
Metric | Value | Source |
SaaS Companies Worldwide | 30,800–42,000+ | Statista, CCCreative |
SaaS Companies in the US | 12,400–17,000 | Statista, CompaniesHistory |
Average SaaS Apps per Company | 101–305 | Okta, Zylo |
Business Apps That Are SaaS-Based (2026) | 85% | Colorlib |
Organisations with Automated SaaS Processes | 81% | Hostinger |
App Consolidation Rate | 5% (down from 14%) | BetterCloud |
The Zylo and Okta numbers for average apps per company diverge significantly (101 vs. 305) because they measure different things. Okta counts apps integrated through its identity platform, while Zylo tracks all SaaS subscriptions across an organisation, including shadow IT and departmental purchases that never touch central IT. That gap itself is revealing — it suggests that organisations have far more SaaS subscriptions than they realise, and SaaS management is becoming a discipline in its own right.
AI and SaaS: The Defining Transformation of 2026
If there is one force reshaping the entire SaaS industry in 2026, it is artificial intelligence. The integration of AI into SaaS products is not an incremental improvement — it is a category-defining shift that is changing how software is built, priced, sold, and valued.
By 2026, more than 80% of companies are expected to have deployed AI-enabled apps in their IT environments, up from just 5% in 2023 (Vena Solutions). That is a 16x increase in three years — one of the fastest enterprise technology adoption curves in history. Up to 40% of enterprise applications now include task-specific AI agents that automate workflows, generate content, analyse data, or make recommendations without human intervention (Thunderbit).
The AI SaaS market specifically is growing at a 38.28% CAGR, from $71.54 billion in 2023 to a projected $775 billion by 2031 (BetterCloud). This growth rate is roughly double the overall SaaS market growth rate, confirming that AI-native products are capturing a disproportionate share of new spending. 63% of organisations now manage AI spend as a separate budget category, with adoption of AI spend management projected to reach 96% by 2026 (Zylo, citing the State of FinOps 2025 Report).
The impact extends to SaaS team sizes and go-to-market strategies. Several founders on X noted in early 2026 that AI-native startups can now build products with 10-person teams that would have required 50-person teams two years ago. This compresses the timeline from idea to market, lowers the capital required to compete, and increases the number of viable competitors in every SaaS category.
AI + SaaS Metric | Value | Source |
Companies with AI-Enabled Apps (2026) | 80%+ | Vena Solutions |
Companies with AI-Enabled Apps (2023) | 5% | Vena Solutions |
Enterprise Apps with AI Agents | 40% | Thunderbit |
AI SaaS Market (2023) | $71.54B | BetterCloud |
AI SaaS Market (Projected 2031) | $775B | BetterCloud |
AI SaaS CAGR | 38.28% | BetterCloud |
Organisations Managing AI Spend | 63% (→96%) | Zylo |
SaaS Platforms with AI-Premium Tiers | 62% | McKinsey |
Buyer Budget Increase for AI Features | 25–35% | McKinsey |
SaaS Pricing: The AI Premium and the Shift to Usage-Based Models
Pricing is one of the most actively debated topics in SaaS in 2026, and for good reason. The introduction of AI features has disrupted pricing models that were stable for years, creating both opportunity and confusion for buyers and sellers alike.
According to McKinsey’s 2026 Software Pricing Report, 62% of SaaS platforms have introduced AI-premium pricing tiers, with buyers budgeting 25–35% higher when AI-enhanced features are included. This represents a significant price increase that is being absorbed by the market because the productivity gains justify the cost — but it is also creating friction.
The broader trend is a shift from per-seat pricing toward usage-based and outcome-based models. Gartner projected that by 2025, over 30% of enterprise SaaS solutions would incorporate outcome-based pricing components, up from approximately 15% in 2022. By 2026, that shift is accelerating. On Reddit’s SaaS communities, the dominant conversation centres on whether usage-based pricing is sustainable for customers. One heavily discussed thread concluded: “Outcome-based pricing is where everything is heading — customers want to pay for results, not seats.”
This pricing evolution has real consequences for SaaS economics. 66.5% of IT leaders experienced unexpected SaaS charges in 2025, often driven by new AI features or usage-based models (Thunderbit). Organisations now spend an average of $55.7 million on SaaS annually, an 8% increase year-over-year (Zylo 2026 SaaS Management Index). The irony is that while SaaS was supposed to simplify software procurement, the combination of AI-premium tiers, usage-based billing, and app sprawl has made SaaS cost management a complex discipline requiring dedicated tools and teams.
SaaS Revenue and Financial Benchmarks
For SaaS builders and investors, the financial benchmarks of 2026 reflect a market that has shifted from growth-at-all-costs to efficient, sustainable growth. After years of volatility — the ZIRP-fueled boom of 2020–2021, the correction of 2022–2023, and the AI-driven reacceleration of 2024–2025 — the market is settling into a new normal where profitability matters as much as growth.
The median SaaS growth rate in 2026 is approximately 26%, though this varies dramatically by stage and segment. AI-native SaaS companies are growing at 40–60% annually, while traditional SaaS companies average closer to 15–20%. The rule of 40 — which says that a SaaS company’s growth rate plus profit margin should exceed 40% — remains the primary benchmark investors use to evaluate SaaS health. In 2026, approximately 30% of public SaaS companies meet this threshold.
Net revenue retention (NRR) has become the single most important metric for SaaS health, surpassing customer acquisition cost (CAC) and lifetime value (LTV) in investor discussions. The target range for NRR is 101–110% for most SaaS companies, with best-in-class enterprise SaaS achieving 120–130%. NRR above 100% means the company generates more revenue from its existing customer base (through expansion, upselling, and cross-selling) than it loses through churn — effectively growing even without acquiring a single new customer.
Financial Benchmark | Value | Segment |
Median SaaS Growth Rate (2026) | ~26% | Overall |
AI-Native SaaS Growth Rate | 40–60% | AI SaaS |
Traditional SaaS Growth Rate | 15–20% | Non-AI SaaS |
Rule of 40 Achievement Rate | ~30% | Public SaaS |
Target NRR (Mid-Market) | 105–110% | Mid-Market |
Target NRR (Enterprise) | 110–130% | Enterprise |
CAC Payback Period (Healthy) | <18 months | B2B SaaS |
Median Gross Margin | 72–78% | Overall SaaS |
Median Annual Contract Value (B2B) | $25K–$50K | Mid-Market |
Top-Decile Workflow Revenue per Recipient | $16.96 | Email SaaS |
Sources: SaaSHero, Baremetrics, Vena Solutions, IdeaProof
SaaS Churn: The Metric That Determines Survival
Churn is the gravity of SaaS economics. No matter how fast a company acquires new customers, excessive churn will eventually overwhelm growth. The benchmarks in 2026 provide a clear picture of what “good” looks like — and how far many companies still need to go.
The median B2B SaaS monthly logo churn rate sits at 3.5%, split between 2.6% voluntary churn and 0.8% involuntary churn (Averi AI 2026 Benchmarks Report). Enterprise-focused products perform significantly better, with median monthly logo churn of just 0.8%. Median annual gross revenue churn across the industry is 12%, with best-in-class companies achieving under 5% (Noizz.io).
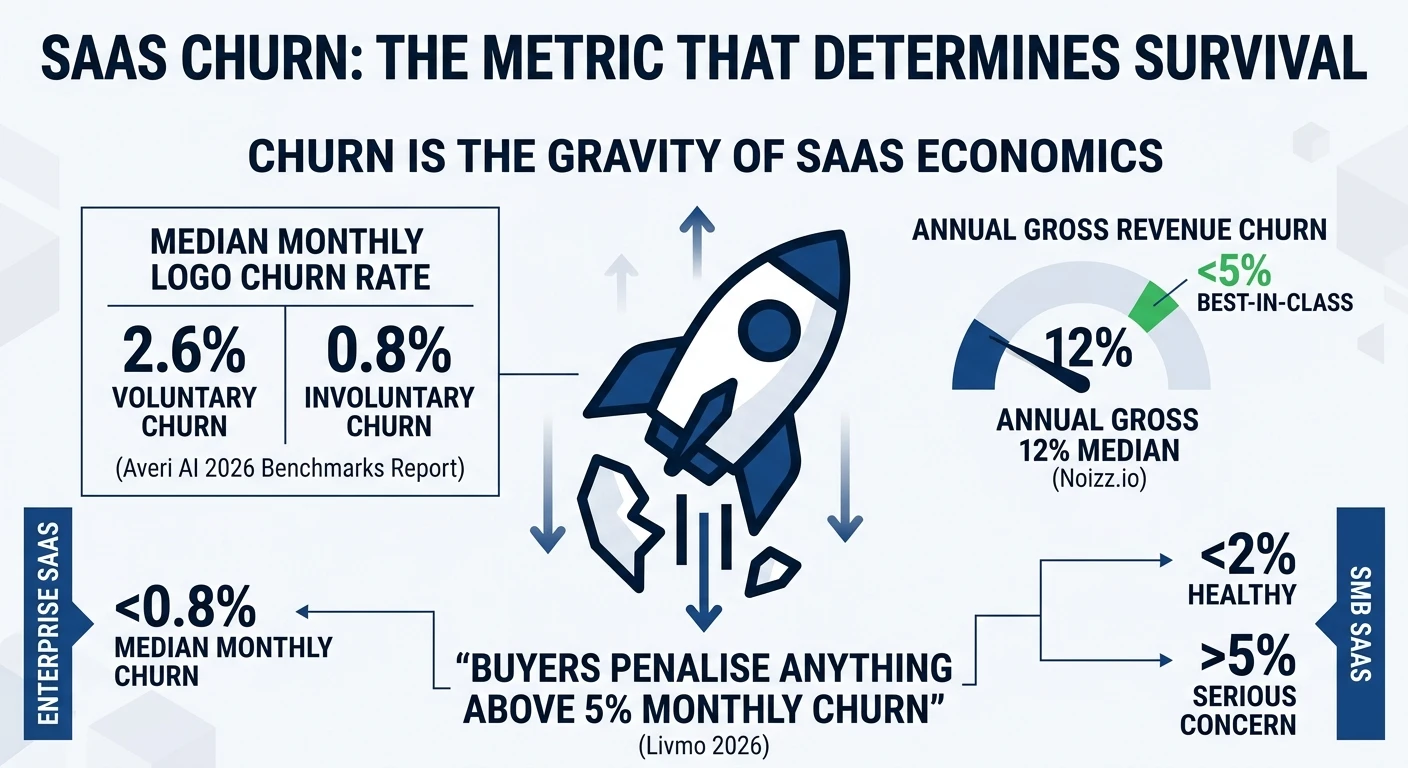
The acceptable churn threshold depends heavily on your market segment. For enterprise SaaS with long sales cycles and high switching costs, a monthly churn above 0.5% signals a product-market fit problem. For SMB SaaS, monthly churn under 2% is considered healthy, and anything above 5% triggers serious concern among buyers and investors. Livmo’s 2026 analysis of acquisition data found that “buyers penalise anything above 5% monthly churn” — meaning that high churn doesn’t just hurt growth, it materially reduces the company’s exit value.
Churn Benchmark | Monthly Rate | Annual Rate | Context |
Enterprise SaaS (Best-in-Class) | <0.5% | <5% | Long contracts, high switching costs |
Enterprise SaaS (Median) | 0.8% | ~10% | Standard enterprise performance |
Mid-Market SaaS | 1–2% | 10–15% | Growing companies, moderate contracts |
SMB SaaS (Median) | 3.5% | ~35% | High volume, lower switching costs |
SMB SaaS (Healthy) | <2% | <20% | Target for SMB-focused SaaS |
B2C SaaS | 5–7% | 50–60% | Consumer products, low commitment |
Best-in-Class Annual Revenue Churn | — | <5% | Top quartile across all segments |
Involuntary Churn (Median) | 0.8% | ~10% | Failed payments, expired cards |
Sources: Averi AI, Noizz.io, Baremetrics, Livmo, Churnfree, UserJot
The voluntary vs. involuntary churn split is instructive. With 0.8% of monthly churn being involuntary (failed payments, expired credit cards), there is a meaningful revenue recovery opportunity for SaaS companies that invest in automated dunning and payment recovery workflows. Many companies lose customers not because of dissatisfaction but because of billing failures that nobody follows up on.
On Reddit’s SaaS communities, churn is one of the most frequently discussed topics. A March 2026 thread on r/SaaS summed up the prevailing wisdom: “Monthly churn under 1% is the goal. Annual churn under 5% is expected for enterprise. And net revenue retention over 100% should be the real target — because that means your existing customers are growing faster than they’re leaving.”
SaaS Adoption by Vertical: Where Software Penetration Is Deepest
SaaS adoption is not uniform across industries. Some verticals have been cloud-native for years, while others are still in the early stages of digital transformation. Understanding these differences matters for both SaaS sellers targeting specific industries and buyers benchmarking their own technology adoption.
Healthcare SaaS is one of the fastest-growing verticals, driven by telehealth expansion, electronic health records, and AI-assisted diagnostics. Financial services SaaS is growing rapidly but faces heavy regulatory constraints around data residency and compliance. Manufacturing SaaS — sometimes called Industry 4.0 — is accelerating as factories adopt IoT, predictive maintenance, and supply chain optimisation platforms.
Education technology (EdTech) SaaS experienced massive growth during the pandemic and has now normalised at a higher baseline. Government and public sector SaaS adoption is growing but remains slower than private sector due to procurement complexity and security requirements. Retail and ecommerce SaaS is deeply mature, with companies in this vertical running some of the highest average SaaS app counts (130+) of any industry.
The general pattern is that B2B verticals with complex workflows and high data volumes are the most receptive to new SaaS adoption, while consumer-facing and regulated industries adopt more cautiously but tend to have higher retention once they commit.
SaaS and the Enterprise: Spending Patterns and Stack Composition
Enterprise SaaS spending tells a story about how large organisations are thinking about technology investment in 2026. The numbers reveal both the opportunity and the complexity.
According to Zylo’s 2026 SaaS Management Index, the average organisation now spends $55.7 million on SaaS annually, an 8% increase year-over-year. Enterprises with over 5,000 employees typically spend $100 million or more, with some large enterprises exceeding $200 million in annual SaaS investment. The SaaS portfolio has flattened in terms of total app count — consolidation is happening — but costs keep rising because the apps that remain are becoming more expensive, largely due to AI-premium pricing.
The composition of the enterprise SaaS stack is shifting. Collaboration tools (Slack, Teams, Zoom) remain the most widely deployed category, followed by CRM (Salesforce, HubSpot), HR/People (Workday, BambooHR), and data/analytics (Snowflake, Databricks). The fastest-growing category in 2026 is AI-native tools — platforms built from the ground up around AI capabilities rather than legacy software with AI bolted on.
Shadow IT remains a persistent challenge. Zylo’s data suggests that the actual number of SaaS applications in an organisation is 2–3x what IT departments officially track. Departmental purchases, individual subscriptions, and free-tier tools that contain company data create security, compliance, and cost management challenges that most organisations have not fully resolved.
What Reddit and X Are Saying About SaaS in 2026
The practitioner conversation about SaaS in 2026 centres on three themes: AI pricing disruption, the sustainability of growth metrics, and the shift from building to buying.
On Reddit’s SaaS communities, the hottest topic is pricing. A widely-discussed thread in February 2026 debated whether usage-based pricing favours vendors at the expense of customers. The top comment argued: “Usage-based pricing sounds fair until your bill is 40% higher than expected because your team used the AI features more than you budgeted for. Outcome-based pricing is where everything is heading — customers want to pay for results, not consumption.” Another commenter pushed back: “Usage-based works if the vendor is transparent about unit costs. The problem isn’t the model — it’s the lack of predictability.”
On X, SaaS founders have been debating what one viral post called “the 10x team phenomenon” — the observation that AI enables a team of 10 to build what previously required 50. The implications are significant: lower capital requirements for new entrants, faster time to market, increased competition in every category, and the potential for a new generation of “micro-SaaS” companies that serve niche needs profitably with very small teams.
Investors on X and LinkedIn have been vocal about the bifurcation of the market. Multiple venture capitalists posted variants of the same thesis in early 2026: “There are two types of SaaS companies now — those with AI at the core and those adding AI as a feature. The market will value them very differently over the next three years.”
Key Takeaways: What These Numbers Mean for Your 2026 Strategy
After analysing 60+ data points across the SaaS landscape, the strategic implications are clear regardless of whether you are a builder, buyer, investor, or operator.
If you are building a SaaS product: The data says AI integration is not optional — 80% of companies have deployed AI-enabled apps, and 62% of platforms already have AI-premium tiers. If your product does not have meaningful AI capabilities, you are competing on features that are being commoditised. Focus on net revenue retention (NRR above 110%), keep churn below 2% monthly for SMB and below 0.5% for enterprise, and consider outcome-based pricing models that align your revenue with customer value.
If you are buying SaaS: Your organisation likely has 2–3x more SaaS subscriptions than IT officially tracks. Budget for 25–35% cost increases on platforms adding AI features. Demand transparency on usage-based pricing before committing to contracts. Consolidate where possible — the drop from 112 to 106 average apps per company suggests the industry is ready for rationalisation, and the savings from eliminating redundant tools can be substantial.
If you are investing in SaaS: The bifurcation between AI-native and traditional SaaS is the defining theme of 2026. AI-native SaaS is growing at 38–60% annually while traditional SaaS grows at 15–20%. NRR is the most predictive metric of long-term value. The Rule of 40 remains the primary filter, but look deeper at how much of the growth is coming from AI-related revenue — that is the growth that is likely to accelerate, not decelerate.
For everyone: The SaaS market at $344–$465 billion is enormous, still growing at nearly 20% annually, and being fundamentally restructured by AI. The companies and individuals who understand these numbers — and act on them — are the ones who will capture disproportionate value from the restructuring that is already underway.
About this article: Statistics were compiled from Statista, Gartner, Mordor Intelligence, Fortune Business Insights, Precedence Research, Zylo 2026 SaaS Management Index, Vena Solutions, BetterCloud, Thunderbit, McKinsey 2026 Software Pricing Report, Baremetrics, Averi AI, Okta, Hostinger, Colorlib, IdeaProof, SaaSHero, Livmo, and community discussions on Reddit (r/SaaS, r/startups) and X. All figures were verified against primary sources as of March 2026.
The global SaaS market is projected to surpass $400 billion by 2026, driven largely by accelerated AI integration and enterprise cloud adoption. This represents a significant leap from previous years, with compound annual growth rates consistently hovering between 18-22%.
AI is fundamentally reshaping SaaS by enabling hyper-personalization, predictive analytics, and automated workflows that reduce manual tasks by up to 40%. Most leading SaaS platforms now embed AI features directly into their core products rather than offering them as add-ons.
Despite product advancements, average SaaS churn rates remain between 5-7% annually because customers have more competitive alternatives and higher expectations for immediate ROI. Vendors that fail to demonstrate measurable value within the first 90 days face significantly higher cancellation risk.
Yes, vertical SaaS solutions targeting specific industries like healthcare, fintech, and construction are growing nearly twice as fast as horizontal platforms. This is because industry-specific tools offer deeper integrations, compliance features, and tailored workflows that generic software cannot match.
Absolutely — affordable AI-powered SaaS tools have democratized capabilities once reserved for enterprise companies, allowing small businesses to automate marketing, customer support, and financial forecasting at minimal cost. Over 60% of small businesses now use at least one AI-enabled SaaS product as part of their core operations.
Comments
Be the first to leave a comment.