
Blockchain technology has evolved from a cryptocurrency experiment to mainstream business infrastructure.
Companies across industries now implement blockchain for supply chains, finance, healthcare, and more.
This comprehensive guide reveals blockchain adoption rates, industry statistics, investment trends, and market growth shaping 2026.
Global Blockchain Adoption Statistics: The Big Picture
Blockchain adoption has accelerated dramatically over the past five years. Businesses and governments recognize its transformative potential.
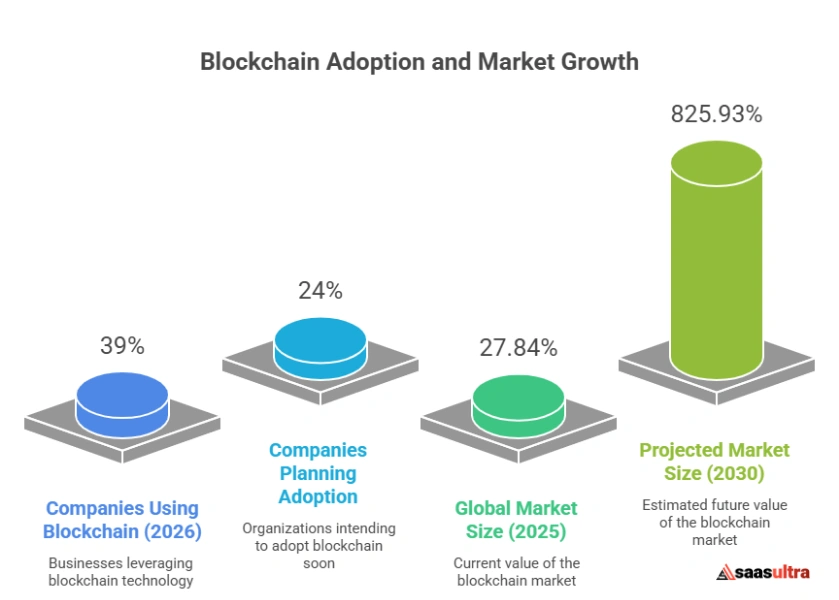
- Companies using blockchain technology (2026): 39%
- Companies planning blockchain adoption within 12 months: 24%
- Global blockchain market size (2025): $27.84 billion
- Projected market size (2030): $825.93 billion
- Compound annual growth rate (CAGR): 87.7%
Nearly 40% of companies worldwide now use blockchain in some capacity. An additional quarter plan adoption within the next year. The blockchain market grows at an astounding 87.7% annually.
Also read about:
Blockchain Market Growth Timeline
Blockchain’s journey from niche technology to enterprise infrastructure happened rapidly.
| Year | Market Size (Billion $) | YoY Growth | Major Milestones |
| 2017 | 1.2 | – | ICO boom |
| 2019 | 3.0 | 58% | Enterprise pilots begin |
| 2021 | 7.18 | 54% | NFT explosion |
| 2023 | 17.46 | 56% | Institutional adoption |
| 2024 | 21.07 | 21% | Regulatory clarity |
| 2025 | 27.84 | 32% | Mainstream integration |
| 2026 | 42.15 | 51% | Supply chain dominance |
The blockchain market has grown from $1.2 billion in 2017 to $42.15 billion projected for 2026. That’s 3,412% growth in just nine years.
Blockchain Users Worldwide
Blockchain reaches millions of users through various applications and cryptocurrencies.
- Blockchain wallet users globally: 420 million
- Active blockchain addresses (monthly): 85 million
- Cryptocurrency owners: 560 million
- NFT owners: 42 million
420 million people own blockchain wallets worldwide. However, many wallets remain inactive. Only 85 million addresses show monthly activity.
Blockchain Adoption by Industry
Different industries adopt blockchain at varying speeds. Some sectors embrace it enthusiastically while others proceed cautiously.
Industry Blockchain Adoption Rates
Blockchain adoption by sector (2026):
| Industry | Adoption Rate | Primary Use Cases | Market Value (Billion $) |
| Financial Services | 68% | Payments, settlements, compliance | 12.4 |
| Supply Chain & Logistics | 52% | Tracking, verification, transparency | 6.8 |
| Healthcare | 43% | Medical records, drug tracking | 3.2 |
| Government & Public Sector | 38% | Identity, voting, records | 2.9 |
| Retail & E-commerce | 35% | Loyalty programs, authenticity | 2.1 |
| Technology & IT | 64% | Infrastructure, development | 4.8 |
| Manufacturing | 41% | Quality control, provenance | 3.6 |
| Energy & Utilities | 37% | Trading, grid management | 2.4 |
| Media & Entertainment | 29% | Rights management, NFTs | 1.8 |
| Real Estate | 27% | Property records, transactions | 1.4 |
Financial services lead blockchain adoption at 68%. Technology companies follow closely at 64%. Traditional industries like real estate lag at 27%.
Financial Services Blockchain Implementation
Banks and financial institutions drive blockchain adoption aggressively.
- Banks using blockchain: 73% of top 100 global banks
- Cross-border payment volume via blockchain: $156 billion annually
- Average transaction cost reduction: 40-60%
- Settlement time reduction: 80%
73 of the world’s 100 largest banks now use blockchain technology. They process $156 billion in cross-border payments annually through blockchain networks.
Major banking blockchain initiatives:
- JPMorgan’s JPM Coin: $1 billion daily transactions
- Ripple network: 300+ financial institutions
- SWIFT blockchain integration: 200+ banks
- Corda (R3): 350+ financial institutions
Supply Chain Blockchain Adoption
Supply chain management represents blockchain’s fastest-growing enterprise use case.
- Companies using blockchain for supply chain: 52%
- Products tracked via blockchain: 2.4 billion items annually
- Supply chain fraud reduction: 68%
- Counterfeit product identification improvement: 82%
Over half of large companies now use blockchain for supply chain tracking. This technology tracks 2.4 billion products yearly from manufacture to consumer.
Major supply chain blockchain projects:
- Walmart food tracing: 25+ products tracked
- Maersk TradeLens: 200+ organizations, 1 billion events
- IBM Food Trust: 500+ food suppliers
- VeChain logistics: 300+ enterprise clients
Blockchain Adoption by Company Size
Enterprise adoption outpaces small business implementation significantly.
Adoption by Organization Size
| Company Size | Adoption Rate | Average Investment | Primary Barriers |
| Enterprise (1000+ employees) | 81% | $2.4M annually | Complexity |
| Large (250-999 employees) | 56% | $480K annually | Skills gap |
| Medium (50-249 employees) | 32% | $95K annually | Cost, knowledge |
| Small (10-49 employees) | 14% | $18K annually | Understanding |
| Micro (1-9 employees) | 6% | $3K annually | Resources |
Enterprise companies show 81% blockchain adoption. Small businesses lag significantly at just 14%. Cost, complexity, and knowledge gaps prevent smaller organizations from adopting.
Fortune 500 Blockchain Adoption
Large corporations lead blockchain implementation. Most Fortune 500 companies now explore or deploy blockchain.
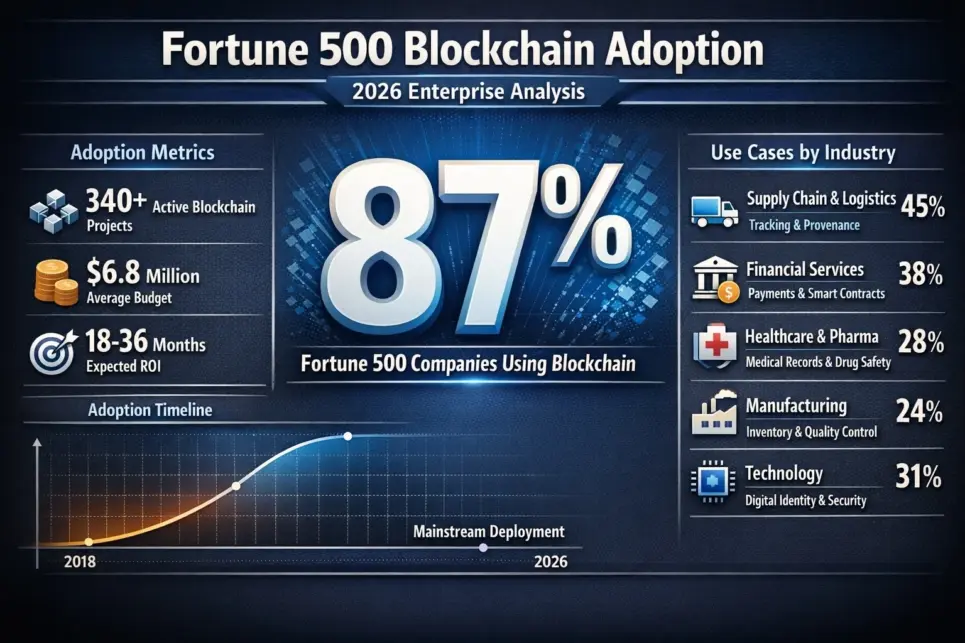
- Fortune 500 companies using blockchain: 87%
- Active blockchain projects among Fortune 500: 340+
- Average blockchain budget (Fortune 500): $6.8 million
- Expected ROI timeframe: 18-36 months
87% of Fortune 500 companies actively use or pilot blockchain technology. They collectively run over 340 active blockchain projects with average budgets exceeding $6 million.
Blockchain Adoption by Region
Geographic adoption varies dramatically. Developed nations lead implementation while developing countries show fastest growth.
Regional Blockchain Market Distribution
Blockchain market by region (2026):
| Region | Market Size (Billion $) | Adoption Rate | YoY Growth |
| North America | 16.2 | 47% | 48% |
| Europe | 11.8 | 38% | 52% |
| Asia-Pacific | 10.4 | 42% | 68% |
| Latin America | 2.3 | 28% | 74% |
| Middle East & Africa | 1.5 | 24% | 82% |
North America leads in absolute market size at $16.2 billion. However, Middle East & Africa show the fastest growth at 82% annually.
Top Countries for Blockchain Adoption
Certain nations embrace blockchain more enthusiastically than others.
Top 15 countries by blockchain adoption (2026):
- United States: 48% adoption, $14.2B market
- China: 46% adoption, $7.8B market
- United Kingdom: 44% adoption, $4.2B market
- Singapore: 52% adoption, $2.1B market
- Switzerland: 49% adoption, $1.8B market
- Germany: 41% adoption, $3.4B market
- Japan: 39% adoption, $2.6B market
- South Korea: 43% adoption, $1.9B market
- Canada: 42% adoption, $1.7B market
- Australia: 40% adoption, $1.4B market
- France: 37% adoption, $1.8B market
- Netherlands: 45% adoption, $1.2B market
- Sweden: 44% adoption, $0.9B market
- United Arab Emirates: 47% adoption, $1.1B market
- India: 35% adoption, $2.8B market
Singapore leads in adoption percentage at 52%, while the United States dominates market size at $14.2 billion.
Government Blockchain Initiatives
Governments worldwide explore blockchain for public services and infrastructure.
- Countries with national blockchain strategies: 58
- Government blockchain projects globally: 340+
- Central Bank Digital Currencies (CBDCs) in development: 130
- Countries with launched CBDCs: 11
58 countries have official national blockchain strategies. 130 nations actively develop Central Bank Digital Currencies, though only 11 have launched them publicly.
Major government blockchain projects:
- Estonia e-Residency: 100,000+ digital residents
- Dubai blockchain strategy: 50% government documents on blockchain by 2026
- Singapore blockchain trade network: 20+ government agencies
- China’s Blockchain Service Network: 128 cities connected
Blockchain Investment and Funding Statistics
Investment in blockchain technology remains robust despite cryptocurrency market volatility.
Venture Capital Blockchain Investment
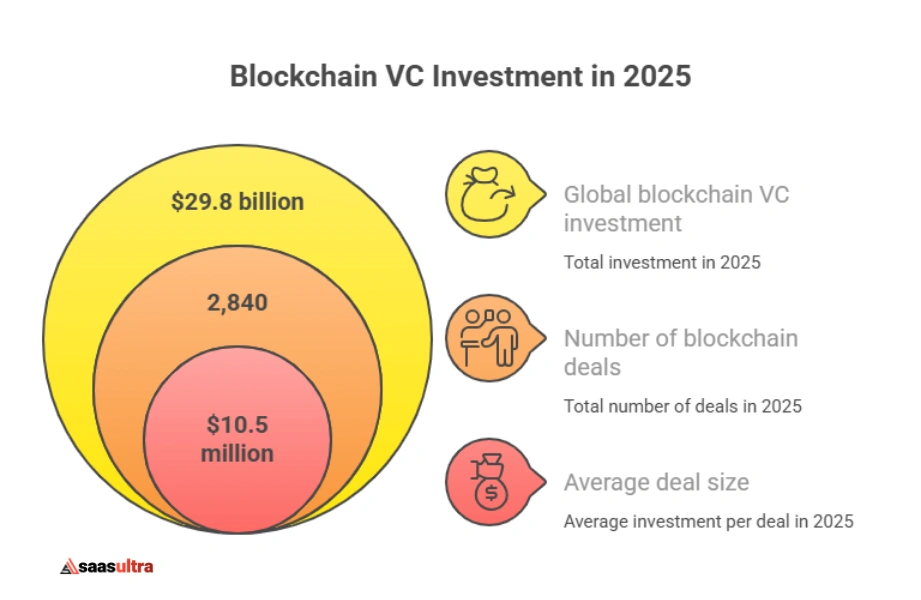
- Global blockchain VC investment (2025): $29.8 billion
- Number of blockchain deals: 2,840
- Average deal size: $10.5 million
- Year-over-year investment growth: 18%
Venture capital invested nearly $30 billion in blockchain companies during 2025. This represents sustained investment despite crypto bear markets.
Largest blockchain funding rounds (2025):
- Figure Technologies: $800M Series E
- Chainalysis: $750M Series F
- Fireblocks: $550M Series E
- Alchemy: $500M Series C
- Consensys: $450M Series D
Corporate Blockchain R&D Spending
Major corporations invest heavily in blockchain research and development.
- Corporate blockchain R&D spending (2025): $18.4 billion
- Companies with dedicated blockchain teams: 4,200+
- Average blockchain team size (Fortune 500): 24 employees
- Blockchain patents filed (2025): 18,600
Companies spent $18.4 billion on blockchain R&D in 2025. Over 4,200 companies maintain dedicated blockchain development teams.
Top blockchain patent holders:
- Alibaba: 2,480 patents
- IBM: 1,850 patents
- Bank of America: 1,240 patents
- Mastercard: 980 patents
- Walmart: 870 patents
Blockchain Developer Statistics
The blockchain developer ecosystem grows rapidly as demand for talent outstrips supply.
- Blockchain developers worldwide: 68,000+
- Year-over-year growth: 34%
- Average blockchain developer salary: $127,000
- Open blockchain developer positions: 42,000
68,000+ developers work full-time on blockchain projects globally. Another 42,000 open positions remain unfilled due to talent shortages.
Developers by blockchain platform:
- Ethereum: 28,000 developers
- Bitcoin: 8,500 developers
- Hyperledger: 6,800 developers
- Solana: 6,200 developers
- Polkadot: 4,800 developers
- Binance Smart Chain: 4,200 developers
Ethereum attracts the most developers with 28,000 active contributors. This represents 41% of all blockchain developers.
Blockchain Use Case Statistics
Blockchain solves various business problems across multiple industries and applications.
Top Blockchain Use Cases
Most common blockchain implementations (2026):
| Use Case | Adoption Rate | Market Size (Billion $) | Growth Rate |
| Cryptocurrency & Payments | 68% | 14.8 | 42% |
| Supply Chain Tracking | 52% | 6.8 | 68% |
| Smart Contracts | 48% | 5.4 | 74% |
| Identity Management | 43% | 4.2 | 82% |
| Data Sharing & Storage | 38% | 3.6 | 58% |
| Healthcare Records | 34% | 2.8 | 88% |
| Voting Systems | 18% | 0.9 | 124% |
| Intellectual Property | 28% | 1.8 | 64% |
Cryptocurrency and payments remain the dominant use case at 68% adoption. However, voting systems show the fastest growth at 124% annually despite lower absolute adoption.
NFT Market Statistics
Non-fungible tokens represent blockchain’s consumer-facing breakthrough.
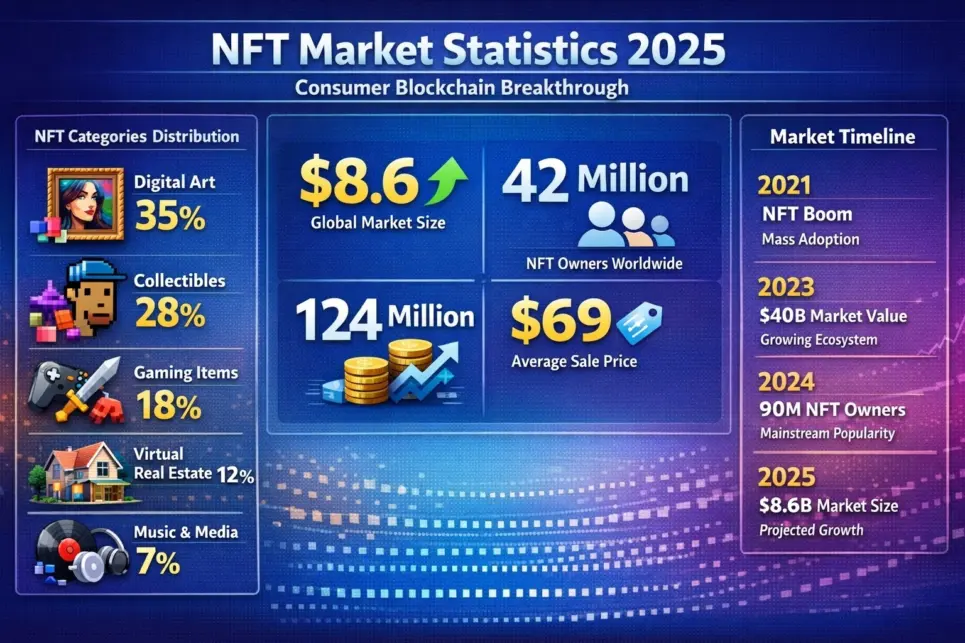
- NFT market size (2025): $8.6 billion
- NFT owners worldwide: 42 million
- NFT transactions (2025): 124 million
- Average NFT sale price: $69
The NFT market reached $8.6 billion in 2025. 42 million people worldwide own at least one NFT. Most transactions involve low-value items averaging $69.
NFT categories by volume:
- Digital art: 38%
- Gaming items: 28%
- Collectibles: 18%
- Virtual real estate: 8%
- Music & media: 5%
- Other: 3%
DeFi (Decentralized Finance) Adoption
Decentralized finance applications run entirely on blockchain networks.
- Total Value Locked (TVL) in DeFi: $185 billion
- DeFi users worldwide: 28 million
- DeFi protocols active: 4,200+
- Average DeFi user portfolio: $6,600
$185 billion sits locked in decentralized finance protocols. 28 million users access banking services without traditional intermediaries.
Blockchain Challenges and Barriers
Despite growth, blockchain faces significant obstacles preventing wider adoption.
Top Blockchain Adoption Barriers
Biggest challenges to blockchain adoption:
| Barrier | Percentage Citing | Impact Level |
| Regulatory uncertainty | 68% | Very High |
| Lack of technical expertise | 62% | High |
| Integration complexity | 58% | High |
| Scalability limitations | 54% | Medium |
| Energy consumption concerns | 48% | Medium |
| Security and privacy concerns | 42% | Medium |
| High implementation costs | 38% | Medium |
| Lack of standards | 34% | Low |
Regulatory uncertainty tops barriers at 68%. Companies hesitate to invest heavily without clear government guidance.
Blockchain Skills Gap
The shortage of qualified blockchain professionals slows adoption significantly.
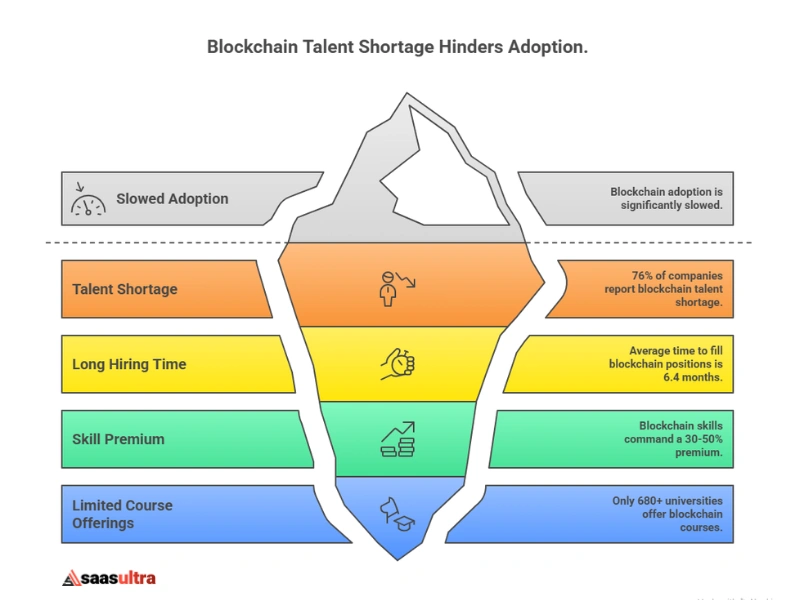
- Companies reporting blockchain talent shortage: 76%
- Time to fill blockchain positions: 6.4 months average
- Premium paid for blockchain skills: 30-50% above standard rates
- Universities offering blockchain courses: 680+
76% of companies struggle to find qualified blockchain talent. Positions remain open for over 6 months on average. Companies pay 30-50% premiums for blockchain expertise.
Enterprise Blockchain Platform Statistics
Several enterprise blockchain platforms compete for business adoption.
Leading Enterprise Blockchain Platforms
| Platform | Enterprise Clients | Industries Served | Primary Features |
| Hyperledger Fabric | 500+ | Finance, supply chain | Permissioned, modular |
| R3 Corda | 350+ | Finance, insurance | Privacy-focused |
| Ethereum Enterprise | 280+ | Multiple | Smart contracts |
| Quorum | 120+ | Finance | Private transactions |
| IBM Blockchain | 520+ | Multiple | Integration tools |
Hyperledger Fabric leads enterprise adoption with 500+ clients. IBM Blockchain serves 520+ organizations through its managed platform.
Enterprise blockchain benefits reported:
- Reduced operational costs: 74%
- Improved transparency: 82%
- Faster transactions: 68%
- Enhanced security: 71%
- Better compliance: 64%
Blockchain and Cryptocurrency Correlation
While blockchain has uses beyond cryptocurrency, crypto remains its largest application.
Blockchain users primarily for crypto: 68%
Blockchain users for non-crypto applications: 32%
Enterprise blockchain projects using cryptocurrency: 24%
Enterprise projects on public chains: 31%
68% of blockchain users interact primarily with cryptocurrency applications. Only 32% use blockchain for non-financial purposes.
Cryptocurrency market statistics:
- Total crypto market cap: $3.2 trillion
- Bitcoin dominance: 48%
- Active cryptocurrencies: 24,000+
- Daily crypto trading volume: $195 billion
Future Blockchain Projections
Blockchain technology will continue expanding rapidly through 2030 and beyond.
Projected blockchain market (2030): $825.93 billion
Expected adoption rate (2030): 68% of companies
Projected blockchain developers (2030): 280,000+
Industries with 75%+ adoption by 2030: 8 major sectors
The blockchain market will grow from $42.15 billion in 2026 to $825.93 billion by 2030. That’s 1,859% growth in just four years.
Emerging blockchain trends:
- Blockchain + AI integration: 64% exploring
- Interoperability solutions: 58% demand
- Green blockchain protocols: 72% priority
- Quantum-resistant blockchain: 34% developing
- Central bank digital currencies: 130 countries
Industries expected to reach 75%+ adoption by 2030:
- Financial services
- Supply chain & logistics
- Healthcare
- Government services
- Insurance
- Real estate
- Energy & utilities
- Media & entertainment
Frequently Asked Questions
1. How many companies use blockchain technology?
39% of companies worldwide use blockchain technology as of 2026, with an additional 24% planning adoption within 12 months. Among Fortune 500 companies, adoption reaches 87%. Enterprise adoption (81%) far exceeds small business implementation (14%).
2. What is blockchain most commonly used for?
Cryptocurrency and payments represent the most common use case at 68% adoption, followed by supply chain tracking (52%) and smart contracts (48%). However, identity management shows the fastest growth at 82% annually.
3. Which industry uses blockchain the most?
Financial services lead with 68% blockchain adoption, followed by technology/IT at 64%. Banks process $156 billion annually in cross-border payments via blockchain, and 73 of the top 100 global banks use blockchain technology.
4. How big is the blockchain market in 2026?
The global blockchain market reached $42.15 billion in 2026, growing 51% year-over-year. North America represents the largest regional market at $16.2 billion, while Asia-Pacific shows the fastest growth at 68% annually.
5. What are the biggest barriers to blockchain adoption?
Regulatory uncertainty tops barriers at 68%, followed by lack of technical expertise (62%) and integration complexity (58%). 76% of companies report blockchain talent shortages, and positions remain open 6.4 months on average.
Also Read:
Conclusion
Blockchain has evolved from a cryptocurrency novelty to essential enterprise infrastructure.
With 39% of companies and 87% of Fortune 500s adopting it, the market has grown 3,412% from 2017 to 2026. Leading sectors include financial services, supply chain, and healthcare.
Despite challenges like regulatory uncertainty and talent shortages, blockchain adoption is expected to surge, reaching $825.93 billion by 2030.
Blockchain is no longer the future, it’s the backbone of digital transformation.
Source: Statista, London Blockchain Conference
Comments
Be the first to leave a comment.