
Customer acquisition cost is the metric that separates SaaS companies that scale sustainably from ones that grow themselves into a cash crisis. You can have a great product, strong NRR, and a talented team — and still build a fundamentally broken business if your CAC economics do not work.
If you are trying to figure out whether what you are spending to acquire customers is reasonable, too high, or genuinely alarming — this article gives you the 2026 benchmarks to compare against. All data pulled from primary research published in 2025 and 2026 including SaaS Capital, BetterCloud, and independent SaaS marketing research.
Here is everything broken down clearly.
The Core CAC Benchmark for 2026
The Headline Number
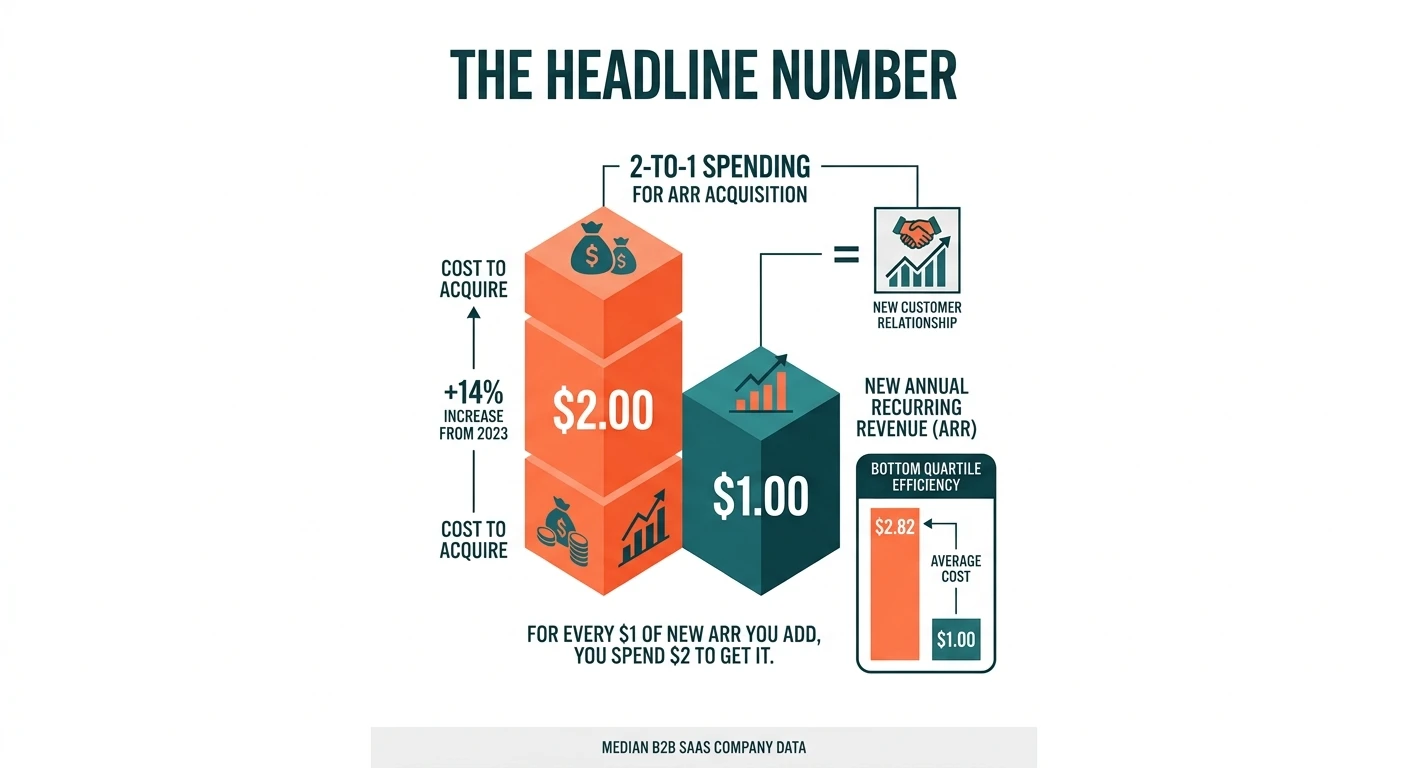
The median B2B SaaS company now spends $2.00 to acquire $1.00 of new annual recurring revenue — a 14% increase from 2023. That means for every $1 of new ARR you add, you are spending $2 to get it.
That number shocks a lot of founders when they first see it — but it is important to understand what it means in context. It does not mean SaaS customer acquisition is broken. It means the payback period on new customer acquisition is typically longer than one year, which is fine as long as customers stay long enough to generate a return on that investment.
The companies in the bottom quartile on acquisition efficiency are spending even more — $2.82 per dollar of new ARR on average. At that level the unit economics require very low churn and significant expansion revenue to generate a positive return on the acquisition investment.
The Average CAC in Dollar Terms
The average customer acquisition cost across B2B SaaS sits at approximately $1,200 per customer — though this number varies enormously depending on your ACV, your sales motion, and the size of the companies you are selling to.
A $99/month SMB SaaS product with a product-led growth motion will have a very different CAC than a $50,000/year enterprise product sold through a field sales team. Both can work — but they require completely different efficiency benchmarks.
CAC by Acquisition Channel — Where the Big Differences Are
This is where the data gets genuinely useful for making real decisions about where to invest your acquisition budget.
Channel | Average CAC |
Referral programs | $150 |
Organic search (SEO) | $480 – $942 |
Paid search (Google Ads) | $802 |
Social advertising | $900 – $1,200 |
Content marketing | $480 – $750 |
Outbound sales | $1,980 |
Events and conferences | $2,000 – $4,000 |
The Referral Advantage
Referral programs have a CAC of just $150 — making them the most cost-efficient acquisition channel in B2B SaaS by a significant margin. Despite this, referral programs are chronically underinvested compared to paid channels that are easier to spin up and attribute directly.
The reason referral programs are so efficient is straightforward. The trust and credibility that come with a customer recommendation dramatically compress the sales cycle, reduce objections, and produce customers who are more likely to stay long-term. The customer doing the referring has already done most of the selling.
Yet most SaaS companies treat referral programs as an afterthought — a tab in the dashboard that nobody actively manages. The CAC data makes a compelling case for treating referral as a primary channel rather than a nice-to-have.
The SEO Case
Organic search generates 44.6% of all B2B SaaS revenue — making it the single largest revenue channel in the industry. And SEO delivers 702% ROI for B2B SaaS companies with a break-even time of just 7 months.
At $480–$942 per customer depending on the competitive intensity of the market, SEO sits in the middle of the CAC range — but the long-term economics are dramatically better than paid channels because the content that ranks continues to generate leads for years without additional spend. A page that ranks well in 2026 can generate customers in 2028 and 2029 at essentially zero incremental cost.
The challenge is that SEO takes time to compound. Most early-stage SaaS companies underinvest in organic content because the results are not immediate — and then spend far more on paid acquisition while their organic traffic sits near zero.
Outbound Sales Cost
Outbound sales has an average CAC of $1,980 — the most expensive self-initiated acquisition channel. That is not a reason to avoid outbound — for enterprise products with high ACV, outbound sales can be the most important growth channel regardless of CAC because the LTV justifies the investment. But for SMB-focused products with ACVs under $5,000, outbound economics rarely work without very high conversion rates or strong product-led assist motions.
CAC Payback Period Benchmarks
CAC in isolation is not the right number to optimize. What matters is how quickly you recover the cost of acquiring a customer — the CAC payback period.
Company Stage | Median CAC Payback Period |
Seed / Pre-Series A | 18 – 30 months |
Series A / B | 12 – 18 months |
Growth stage ($20M+ ARR) | 8 – 14 months |
Top quartile performers | Under 12 months |
A CAC payback period of under 12 months is generally considered strong for B2B SaaS. Under 18 months is acceptable. Over 24 months starts to create cash flow pressure unless the company is well-funded and churn is very low.
The reason payback period matters more than raw CAC is that it accounts for what you are charging. A $2,000 CAC on a $500/month product (4-month payback) is far better than a $2,000 CAC on a $100/month product (20-month payback) — even though the dollar cost is identical.
The CAC Ratio — Linking Acquisition Cost to Revenue Efficiency
The CAC ratio — the cost of acquiring $1 of new ARR — is one of the most widely used efficiency metrics in SaaS investing and benchmarking.
CAC Ratio | What It Means |
Under $1.00 | Exceptional — rare outside product-led growth companies |
$1.00 – $1.50 | Strong — top quartile B2B SaaS performance |
$1.50 – $2.00 | Average — median market performance |
$2.00 – $2.50 | Below average — acquisition efficiency needs attention |
Above $2.50 | Concerning — unit economics require significant improvement |
The median of $2.00 sits right at the average/below-average boundary — which tells you that the typical private SaaS company’s CAC efficiency is not great. The top performers are doing significantly better, and the bottom quartile at $2.82 is in territory where the business model needs real attention.
What Drives CAC Up — The 2026 Factors
Several factors are pushing CAC higher across the market in 2026 specifically.
Paid channel saturation. Google and Meta advertising costs have risen consistently for a decade as more advertisers compete for the same inventory. The SaaS companies that built their growth engines on paid search and social advertising in 2018 and 2019 at much lower CPCs are now facing meaningfully higher acquisition costs for equivalent traffic.
Longer sales cycles. The average B2B customer journey now takes 211 days and requires 76 touchpoints before purchase. Economic uncertainty has made buyers more cautious — more stakeholders involved in decisions, longer evaluation periods, more requests for proof of value before signing. All of this extends the sales cycle and increases the cost of closing each deal.
Sales team costs. SaaS sales compensation has risen significantly — driven by competition for experienced enterprise sales talent and the general wage inflation in tech roles over the past three years. Higher salaries translate directly to higher CAC for sales-led growth companies.
Content saturation. SEO and content marketing CAC is rising in competitive categories as more SaaS companies invest in organic content and the gap between what ranks at the top and what gets no traffic grows wider. Getting to the first page is harder and more expensive than it was two or three years ago.
How to Reduce Your SaaS CAC
The data points toward a clear set of priorities for companies looking to improve acquisition efficiency.
Invest in referral before almost anything else. At $150 CAC, the ROI on a well-structured referral program is almost always better than any other channel. Most SaaS companies have not built a proper referral program — which means there is usually significant low-hanging fruit here.
Build organic content before scaling paid. The 702% SEO ROI figure is real — but it requires patience. The companies with the lowest CAC in mature categories built their organic presence two to three years before their competitors woke up to the opportunity. The best time to start is always earlier than feels necessary.
Improve your activation rate. A surprising amount of CAC waste happens after the customer signs up rather than before. Poor onboarding means customers who could have become long-term paying users never reach their first meaningful outcome and churn early — wasting the entire acquisition spend. Fixing onboarding reduces effective CAC even though it does not change the acquisition cost.
Tighten your ICP. Acquiring the wrong customers is more expensive than acquiring the right ones — they take longer to close, need more support, expand less, and churn faster. The tighter your ideal customer profile, the more efficient every dollar of acquisition spend becomes because you are not wasting it on prospects that were never going to be good customers.
Product-led growth where it fits. PLG companies — where the product itself drives acquisition through free trials, freemium, or viral loops — consistently report lower CAC than sales-led companies. Not every product lends itself to PLG, but for those that do the CAC efficiency advantage is substantial and compounds over time.
CAC vs LTV — The Ratio That Really Matters
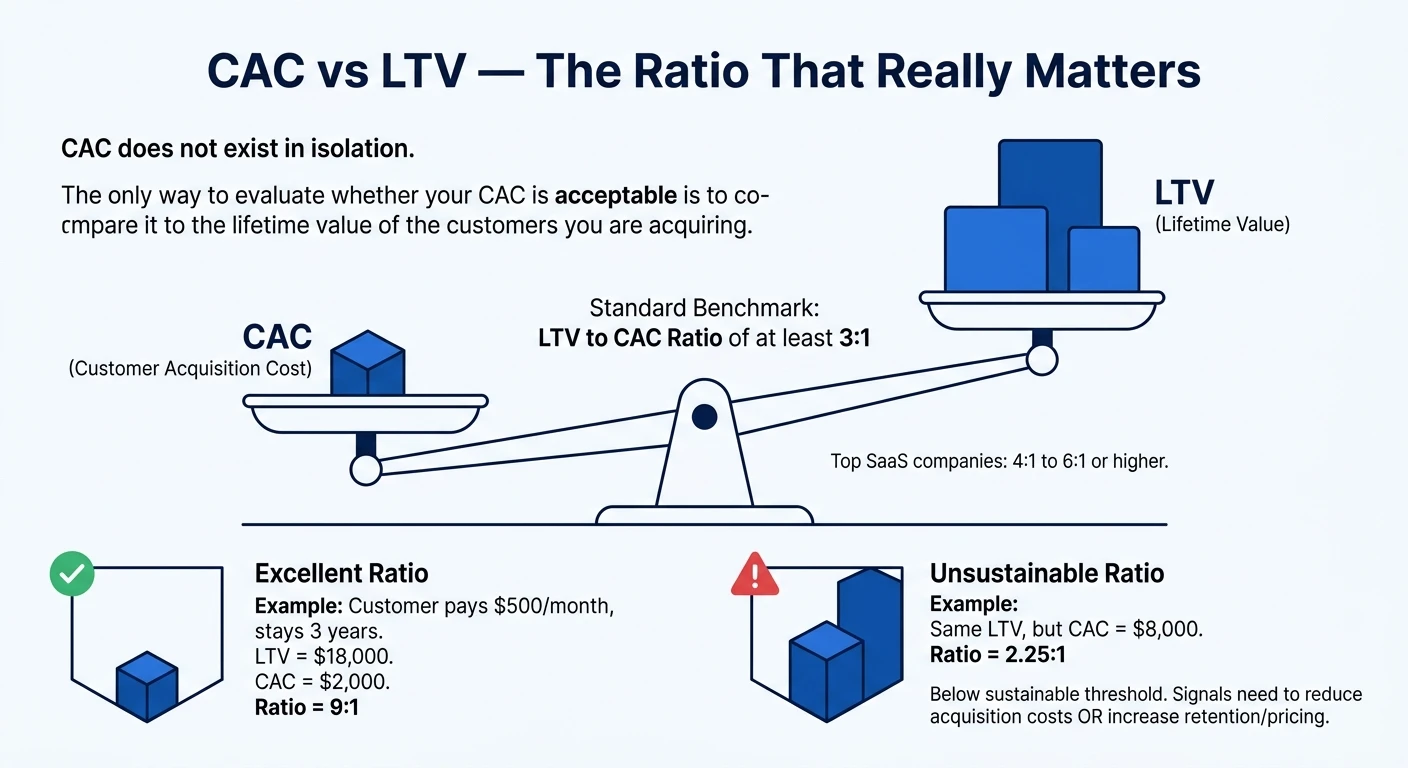
CAC does not exist in isolation. The only way to evaluate whether your CAC is acceptable is to compare it to the lifetime value of the customers you are acquiring.
The standard benchmark is an LTV to CAC ratio of at least 3:1 — meaning the lifetime value of each customer should be at least three times what you spent to acquire them. Top-performing SaaS companies typically operate at 4:1 to 6:1 or higher.
If your average customer pays $500/month and stays for 3 years, their LTV is $18,000. A CAC of $2,000 gives you a 9:1 LTV:CAC ratio — excellent. A CAC of $8,000 gives you a 2.25:1 ratio — below the sustainable threshold and a signal that either acquisition costs need to come down or retention and pricing need to go up.
The formula most commonly used:
LTV = (Average MRR per customer × Gross Margin %) ÷ Monthly Churn Rate
LTV:CAC = LTV ÷ CAC
Running these numbers monthly — not just at fundraising time — is one of the most important operational habits in SaaS financial management.
Conclusion
The median B2B SaaS company spending $2.00 to acquire $1.00 of new ARR is not a sign of a broken industry — it is a sign of a maturing one where the easy, cheap growth channels have become crowded and competitive. The companies that maintain CAC efficiency in this environment are the ones investing in referral, organic content, and product-led growth rather than simply outspending competitors on paid channels.
The two numbers worth keeping front of mind: referral programs cost $150 per customer and SEO generates 702% ROI. Both are dramatically more efficient than the median $2.00 CAC ratio — and both are chronically underinvested by most SaaS companies relative to paid acquisition. If your CAC is trending above $2.00 per dollar of ARR, those are the first two places to look before touching anything else.
We will keep this benchmark updated as new data comes in through 2026.
Sources: Oliver Munro SaaS Marketing Statistics 2026, SaaS Capital 2026 Annual Survey, BetterCloud SaaS Statistics 2026, Growth Navigate B2B SaaS Statistics 2026.
SaaS NRR Benchmarks 2026: What Is Good Net Revenue Retention?
Net Revenue Retention is the metric that sophisticated SaaS investors look at before almost anything else — and for good reason. It tells you more about the health of a SaaS business in a single number than almost any other metric available. A company with strong NRR can grow without acquiring a single new customer. A company with weak NRR is running on a treadmill no matter how fast it signs new deals.
If you are trying to figure out whether your NRR is where it should be, how it compares to peers, and what the best companies in the market are achieving — this article gives you the clearest picture available from 2026 data. All benchmarks sourced from SaaS Capital’s annual survey of 1,000+ private B2B SaaS companies and other primary research published in 2025 and 2026.
Here is the full breakdown.
What Is Net Revenue Retention?
Before the benchmarks, a quick definition for anyone who wants to make sure they are calculating it the same way the benchmarks do.
Net Revenue Retention (NRR) measures the percentage of revenue retained from your existing customer base over a period — accounting for expansion revenue (upgrades, upsells, additional seats) as well as revenue lost to churn and downgrades.
The formula:
NRR = (Starting MRR + Expansion MRR − Churned MRR − Contraction MRR) ÷ Starting MRR × 100
If you start January with $100,000 in MRR from existing customers, add $15,000 in expansion from those same customers, lose $8,000 to churn, and see $2,000 in downgrades — your NRR is:
($100,000 + $15,000 − $8,000 − $2,000) ÷ $100,000 × 100 = 105%
An NRR above 100% means your existing customer base is growing in revenue even before you add a single new customer. An NRR below 100% means your existing customer base is shrinking — and you need new customer acquisition just to stay flat.
NRR Benchmarks for 2026 — The Core Numbers
Across All Private SaaS Companies
Percentile | NRR |
25th percentile | 88% |
50th percentile (median) | 101% |
75th percentile | 112% |
90th percentile | 120%+ |
The median NRR across private SaaS companies in 2026 is approximately 101% — meaning the typical private SaaS business is just barely keeping its existing revenue base growing net of all churn and contraction.
That 101% median is actually a meaningful number despite how close it is to the flat line. It means that for the average private SaaS company, existing customers are a mild tailwind rather than a drag — which gives the business a small compounding advantage before counting any new customer acquisition.
For Bootstrapped SaaS Companies ($3M–$20M ARR)
From SaaS Capital’s 2026 survey specifically covering bootstrapped companies at the scale-up stage:
Percentile | NRR |
25th percentile | 91.3% |
50th percentile (median) | 103% |
75th percentile | 110.2% |
90th percentile | 117.9% |
Bootstrapped SaaS companies at this stage median slightly above the overall market at 103% — likely reflecting the customer selectivity and product discipline that tends to come with building without external capital pressure.
The 90th percentile at 117.9% is the number that separates good from exceptional. Companies hitting this level have built genuine expansion revenue engines — not just low churn, but active mechanisms that cause existing customers to spend more over time.
What Good NRR Looks Like at Different Stages
NRR benchmarks shift as companies scale — because the customer mix, pricing structure, and expansion mechanisms available to a $2M ARR company are very different from those available to a $100M ARR company.
ARR Stage | Good NRR | Great NRR | Exceptional NRR |
Under $1M ARR | 85%+ | 95%+ | 100%+ |
$1M – $5M ARR | 90%+ | 100%+ | 110%+ |
$5M – $20M ARR | 95%+ | 105%+ | 115%+ |
$20M – $50M ARR | 100%+ | 110%+ | 120%+ |
Above $50M ARR | 105%+ | 115%+ | 125%+ |
The benchmarks rise with company size for a few reasons. Larger companies tend to have more sophisticated expansion revenue mechanisms. They sell to larger customers where seat expansion is more natural. They have dedicated customer success teams that actively drive expansion rather than just managing churn. And their pricing structures have usually been optimized through several iterations by the time they reach significant scale.
NRR vs GRR — Understanding Both Numbers
NRR and Gross Revenue Retention (GRR) are related but measure different things — and both matter.
GRR measures only the revenue you keep from existing customers — without counting any expansion. It is a pure measure of churn and downgrade losses with no expansion to offset them.
NRR adds expansion revenue on top of GRR — showing whether the total revenue from your existing customer base grows or shrinks after accounting for everything.
The relationship between them tells you something important about your business model:
High GRR + High NRR — Low churn and strong expansion. The best combination. Your customers are staying and spending more.
Low GRR + High NRR — High churn being offset by very strong expansion from the customers who stay. This is common in usage-based models — some customers churn but the ones who stay grow rapidly.
High GRR + Low NRR — Customers are staying but not expanding. You are retaining revenue but leaving upsell opportunity on the table.
Low GRR + Low NRR — Customers are leaving and those who stay are not growing. Retention urgency is high.
From SaaS Capital’s 2026 data for bootstrapped companies at $3M–$20M ARR:
Median GRR: 91% (losing about 9% of existing revenue to churn and downgrades before expansion)
Median NRR: 103% (gaining back those losses and then some through expansion)
The 12-point gap between GRR and NRR tells you that expansion revenue is doing meaningful work for the median bootstrapped SaaS company — adding approximately 12% of starting revenue through upgrades and upsells that more than offset the 9% lost to churn.
Best-in-Class NRR — What the Top Performers Look Like
To calibrate what exceptional NRR actually looks like, it helps to look at some well-documented high-NRR SaaS companies even if they are at the larger end of the market.
Some of the highest NRRs ever reported by public SaaS companies:
Company | Peak NRR Reported |
Snowflake | 158% |
Datadog | 130%+ |
Confluent | 130%+ |
125%+ | |
Veeva Systems | 120%+ |
These are outliers — companies with usage-based pricing models, massive enterprise customer bases, and deep product ecosystems that make expansion a natural outcome of customer success rather than a forced upsell motion. But they show what is possible and give you a sense of the structural characteristics that drive exceptional NRR.
The common factors across high-NRR SaaS businesses:
Usage-based or seat-based pricing that expands naturally with customer growth
Platform or ecosystem products where customers add modules over time
Strong customer success that actively identifies and captures expansion opportunities
High-quality ICP targeting that brings in the right customers from the start — the ones with budget, growth trajectory, and genuine product fit
What Drives NRR — The Levers You Can Pull
Expansion Revenue
This is the most powerful NRR lever and the most underinvested in most SaaS businesses. Expansion revenue — revenue from existing customers upgrading, buying additional seats, or purchasing additional products — is what separates a 103% NRR from a 117% NRR.
Expansion ARR now represents 40% of new revenue for top-performing SaaS companies. That means four out of every ten dollars of new ARR is coming from customers you already have — not new sales. Companies that achieve this are not doing it through aggressive upselling. They are doing it by building pricing structures where expansion is the natural outcome of customer success.
The most effective expansion mechanisms in 2026:
Seat expansion — pricing per user means the product grows revenue automatically as customers hire
Usage tiers — customers upgrade as their usage grows beyond tier limits
Multi-product — customers buy additional products from the same vendor as trust grows
Outcome-based pricing — customers pay more as they achieve better results
Churn Reduction
Every percentage point of churn you prevent has two effects on NRR. It directly adds to your GRR. And it gives you more existing customers to generate expansion revenue from.
The most effective churn reduction levers based on current research:
Better onboarding. Customers who reach their first meaningful outcome quickly are dramatically less likely to churn in the first 90 days — which is when the majority of SMB churn happens. Time-to-value is the single most important onboarding metric for NRR.
Usage monitoring and early intervention. Customers who stop logging in, stop completing key actions, or show declining usage patterns are signalling future churn. Most SaaS companies have this data and do not act on it systematically enough.
Renewal process. The renewal conversation should not be a surprise. Customers who receive a genuine business review 60–90 days before renewal — one that ties their usage data to measurable business outcomes — renew at significantly higher rates than those who receive an automated invoice.
Contraction Prevention
Contraction — customers downgrading to lower tiers or reducing seats — is often overlooked as a separate problem from churn. But it has a direct and measurable impact on GRR and NRR.
The most common cause of contraction is customers who over-bought initially — signed up for more seats or a higher tier than they needed — and right-size at renewal. The fix is better qualification upfront: selling customers what they need now with a clear expansion path, rather than closing the largest possible initial deal.
NRR by Business Model
Not all SaaS products are built the same way and NRR benchmarks vary significantly by business model:
Business Model | Typical NRR Range |
Usage-based SaaS | 110 – 140% |
Seat-based enterprise SaaS | 105 – 125% |
Multi-product platform SaaS | 110 – 130% |
Single-product SMB SaaS | 90 – 105% |
Consumer SaaS | 70 – 95% |
Vertical SaaS | 100 – 120% |
Usage-based and platform SaaS consistently deliver the highest NRR because expansion is structurally built into the revenue model — customers spend more as they use more or add more products, without requiring a separate sales motion for each increment.
Single-product SMB SaaS has the most limited NRR ceiling because there are fewer natural expansion mechanisms once a customer is on the right plan. Companies in this position that want to improve NRR typically need to either add a higher tier with genuine additional value, introduce usage-based components, or build adjacent products.
How Investors Use NRR
Understanding how investors read NRR benchmarks is useful whether you are raising capital or just trying to understand how your business will be valued.
NRR above 120% is generally considered a strong signal of product-market fit and expansion potential. Investors at growth stage will sometimes pay premium multiples for companies with demonstrated high NRR because the compounding math is so powerful — a business growing its existing revenue base at 20% per year before any new customer acquisition has an extremely strong floor on its revenue trajectory.
NRR between 100% and 120% is the range where most well-run SaaS businesses operate. At Series A and B, investors will look for NRR in this range as a baseline — it tells them the product is working and customers are finding value.
NRR below 100% is a yellow flag at Series A and a red flag at later stages. It means the company needs new customer acquisition to offset existing revenue losses — which makes growth more expensive, more fragile, and more dependent on continuous marketing and sales execution rather than the compounding of a healthy existing base.
NRR below 85% requires an explanation. At this level, the business is losing revenue from existing customers faster than most expansion mechanisms can offset. Either the product has a fundamental value delivery problem or the customer success function has a significant gap.
Conclusion
Good NRR for a SaaS company in 2026 is above 100% for most B2B products — with the median sitting at 101% across all private SaaS and 103% for bootstrapped companies at the scale-up stage. The top 10% of bootstrapped SaaS companies hit 117.9% — a level that requires both strong retention and active expansion revenue mechanisms working together.
The two levers that move NRR most reliably are reducing early churn through better onboarding and building expansion revenue into the pricing structure rather than relying on sales-driven upsells. Companies that get both right consistently operate in the 110–120% range. Companies that neglect both typically find themselves in the 85–95% zone — retaining customers but not growing from them.
NRR is not just a metric for fundraising conversations. It is the clearest signal of whether your product is genuinely delivering value to customers over time. If customers are expanding their spend, the product is working. If they are churning or contracting, no amount of new customer acquisition will fix what is fundamentally a product and retention problem.
We will update these benchmarks as new survey data becomes available through 2026.
FAQs
A healthy SaaS CAC varies by segment, but most benchmarks suggest SMB-focused companies should aim for a CAC under $1,000, mid-market around $5,000-$15,000, and enterprise can exceed $50,000. The key metric is not CAC alone but the CAC-to-LTV ratio, which should ideally be 1:3 or better.
Divide your total sales and marketing expenses over a given period by the number of new customers acquired in that same period. For example, if you spent $100,000 on sales and marketing in Q1 and acquired 50 customers, your CAC is $2,000.
The industry standard benchmark is a 3:1 LTV-to-CAC ratio, meaning your customer lifetime value should be at least three times what you spent to acquire them. Ratios below 3:1 often signal inefficient spending, while ratios above 5:1 may indicate underinvestment in growth.
High CAC is often caused by long sales cycles, inefficient marketing channels, poor lead qualification, or a mismatch between your ICP and targeting strategy. Auditing your funnel conversion rates and channel-level attribution can help pinpoint where acquisition costs are inflating.
Many SaaS investors and operators consider CAC payback period equally or more important, as it measures how many months it takes to recoup acquisition costs through gross profit. A benchmark of under 12 months is considered strong for SMB SaaS, while enterprise models can sustain 18-24 month payback periods.
Comments
Be the first to leave a comment.