
If you are looking for SaaS statistics that are actually current, you are in the right place. Most articles ranking for this topic are recycling data from 2021 or 2022 with a new year in the title, which is not particularly useful when the market has shifted as dramatically as it has in the last 24 months.
This article pulls from primary research published in 2025 and 2026 — including SaaS Capital’s annual survey of 1,000+ private B2B SaaS companies, Zylo’s SaaS Management Index tracking $75 billion in real SaaS spend, Gartner, IDC, and BetterCloud. Whether you are benchmarking your own SaaS business, researching the market before a pitch, or just trying to understand where the industry is heading, the numbers below will give you a clear picture.
What the SaaS Industry Looks Like in 2026 — At a Glance
Before we get into the details, here are the headline numbers:
Metric | 2026 Figure |
Global SaaS market value | $465 billion |
Number of SaaS companies worldwide | 30,800+ |
Average annual SaaS churn rate | 5.2% |
Median bootstrapped SaaS growth rate | 15% |
Companies using SaaS in operations | 95%+ |
Average apps per enterprise | 106 |
AI SaaS market projected value (2031) | $775 billion |
SaaS companies formally monetizing AI | 41% |
IT leaders who faced renewal price hikes | 79% |
Median NRR for private SaaS companies | 101–103% |
These numbers tell a clear story. The SaaS market is maturing. Growth is slowing slightly compared to the pandemic-era boom, but the industry is nowhere near a ceiling. What’s changing is how the growth is happening — AI, usage-based pricing, and consolidation are reshaping the game.
SaaS Market Size & Growth Statistics
Let’s start with the big picture numbers that put everything else in context.
The Market Is Bigger Than Most People Realise
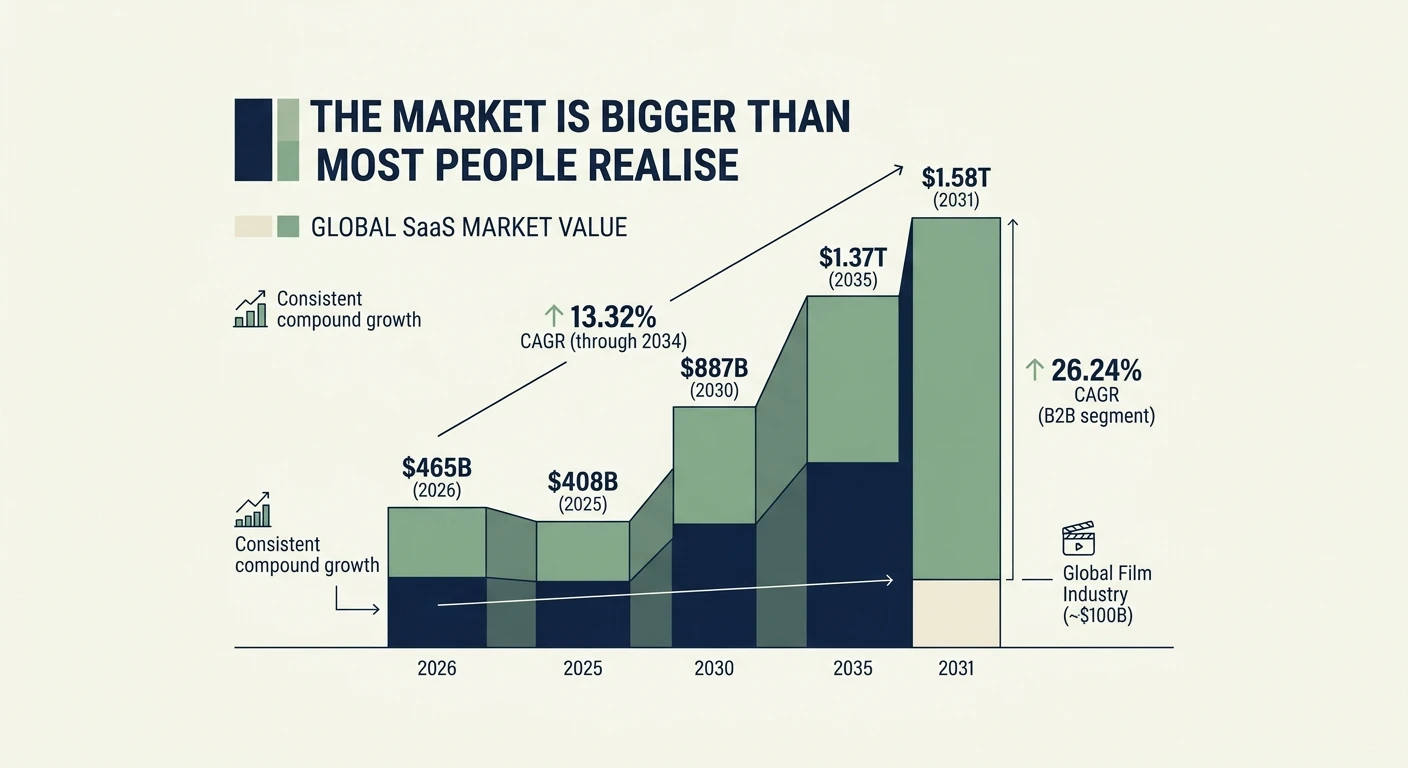
The global SaaS market hit $465 billion in 2026, up from $408 billion in 2025. That’s a meaningful year-on-year jump, and it happened despite a broader tech slowdown that squeezed valuations and dried up venture funding in 2023 and 2024.
To put that number in perspective: the entire global film industry generates around $100 billion a year. SaaS is more than four times that size and growing.
Long-range forecasts suggest the market will reach $887 billion by 2030 and potentially $1.37 trillion by 2035. The compound annual growth rate through 2034 is projected at around 13.32% — not explosive, but extremely consistent for an industry this large.
The B2B SaaS segment is forecast to grow even faster, with some projections putting it at $1.58 trillion by 2031 at a 26.24% CAGR. The distinction between B2B and B2C SaaS is becoming more commercially important as enterprise software spending continues to outpace consumer.
Where the Growth Is Coming From
North America still dominates. By 2026, the North American SaaS market is estimated at $211.7 billion — around 46% of the entire global market. The U.S. alone is home to 17,000 SaaS companies, which is 8.5 times more than the UK, the second-largest SaaS market.
But the rest of the world is catching up fast. Europe and Asia-Pacific are both growing their SaaS adoption rates significantly, driven by cloud migration, digital transformation, and — increasingly — AI integration across business functions.
U.S.-based SaaS companies serve nearly 14 billion users worldwide. That’s not a typo. It reflects how deeply embedded American SaaS platforms are in global business infrastructure — from small businesses using QuickBooks to multinationals running on Salesforce and Microsoft 365.
How Many SaaS Companies Are There?
As of 2026, there are over 30,800 SaaS companies globally, up 23% from around 25,000 in 2021. Most of them are small — the average SaaS company has around 36,000 customers, but that average is heavily skewed by the giants.
The U.S. accounts for more than half of all SaaS companies. After the U.S., the countries with the most SaaS companies are the UK, Canada, Germany, and Australia in roughly that order.
By industry segment, the most crowded SaaS categories are productivity and collaboration tools, followed by marketing automation, CRM, and HR software.
SaaS Growth Rate Benchmarks
Growth rate is the metric most founders obsess over — and for good reason. It drives valuation multiples, investor interest, and competitive positioning. But context matters enormously. A 20% growth rate means something very different at $500K ARR versus $50M ARR.
Private SaaS Growth Rates in 2026
According to SaaS Capital’s 2026 annual survey of more than 1,000 private B2B SaaS companies:
Median growth rate across all private SaaS companies: approximately 30% — though this drops significantly as companies scale
Companies with ARR under $1M report a median growth rate of 50%
Companies with ARR above $20M report closer to 25%
Bootstrapped SaaS companies with $3M–$20M ARR report a median growth rate of 15% in 2026
The 90th percentile of bootstrapped companies in that same ARR range grows at 42.3%
That last number is worth sitting with. The difference between the median bootstrapped SaaS company and the top 10% isn’t 5% or 10% — it’s nearly 30 percentage points of growth. That gap is where most of the strategic questions live.
Growth Is Slowing — But That’s Not Necessarily Bad
Compared to the previous year, bootstrapped SaaS median growth dropped from 20% to 15%, and the 90th percentile fell from 51% to 42.3%. That’s a real decline, not noise in the data.
But context matters. The companies that grew at 50%+ during 2021 and 2022 were often doing so on the back of pandemic-driven digital transformation budgets that have since normalized. A 15% median growth rate for a bootstrapped SaaS company generating real profit is a genuinely strong business outcome — not a failure.
Equity-backed companies tend to grow faster than bootstrapped ones — which is expected, given they’re deploying external capital into sales and marketing. Vertical SaaS companies (focused on a specific industry) report slightly higher growth at 31% compared to 28% for horizontal SaaS companies. Specialization is paying off.
SaaS AI Adoption Statistics
This is the section that’s moving fastest. Every data point from 12 months ago is already out of date — AI adoption in SaaS has accelerated faster than almost any analyst predicted.
Where AI Stands in SaaS Right Now
41% of SaaS companies are formally monetizing AI in 2026 — meaning AI is a revenue line, not just a feature
Of those monetizing AI, 53% use subscription pricing rather than usage-based or add-on models
60%+ of enterprise SaaS products now have embedded AI features
92% of SaaS companies plan to increase AI use in their products over the next 12 months
68% of CEOs plan to increase AI spending in 2026 — the budget commitment is real, not just aspirational
The average organization now uses 7.3 SaaS apps with AI functionality — and that number is climbing fast
7% of total SaaS apps in use are AI-enabled as of 2025
The Bigger Picture on AI + SaaS
The global AI SaaS market is expected to grow at a 38.28% CAGR from 2023 to 2031, reaching approximately $775 billion by 2031. By any measure, this is the most significant structural shift the SaaS industry has experienced since the move from on-premise software to cloud delivery.
By the end of 2026, more than 80% of companies are expected to have deployed AI-enabled apps in their IT environments — up from just 5% in 2023. That’s an extraordinary adoption curve compressed into three years.
Agentic AI — AI that takes autonomous actions rather than just answering questions — is the next frontier. According to IDC, agentic AI spending is expected to exceed 26% of worldwide IT spending over the next five years, hitting $1.3 trillion by 2029. As of late 2025, 33% of organizations with 1,000+ employees have already deployed agentic AI, with another 48% expecting to do so within 12 months.
The Shadow AI Problem
Here’s the uncomfortable stat that IT leaders are not talking about publicly but are very much worried about privately. Approximately 8 in 10 office workers are now using public AI tools without the explicit knowledge or approval of their IT departments.
And it gets more complicated. 70% of employee AI interactions happen through features embedded inside existing, sanctioned SaaS applications — which means even when IT thinks they have visibility, they’re often missing the majority of actual AI usage. This creates both a security risk and a budget inefficiency problem that most organizations are still trying to solve.
30% of traditional SaaS workflows will be replaced by AI-driven automation by 2027, according to Gartner. The replacement isn’t happening all at once — it’s happening function by function, use case by use case, as AI features in existing tools gradually make manual steps unnecessary.
SaaS Pricing Statistics
Pricing is where SaaS companies make or lose years of competitive advantage — and it’s one of the most under-analyzed areas in most SaaS businesses.
The Renewal Price Problem
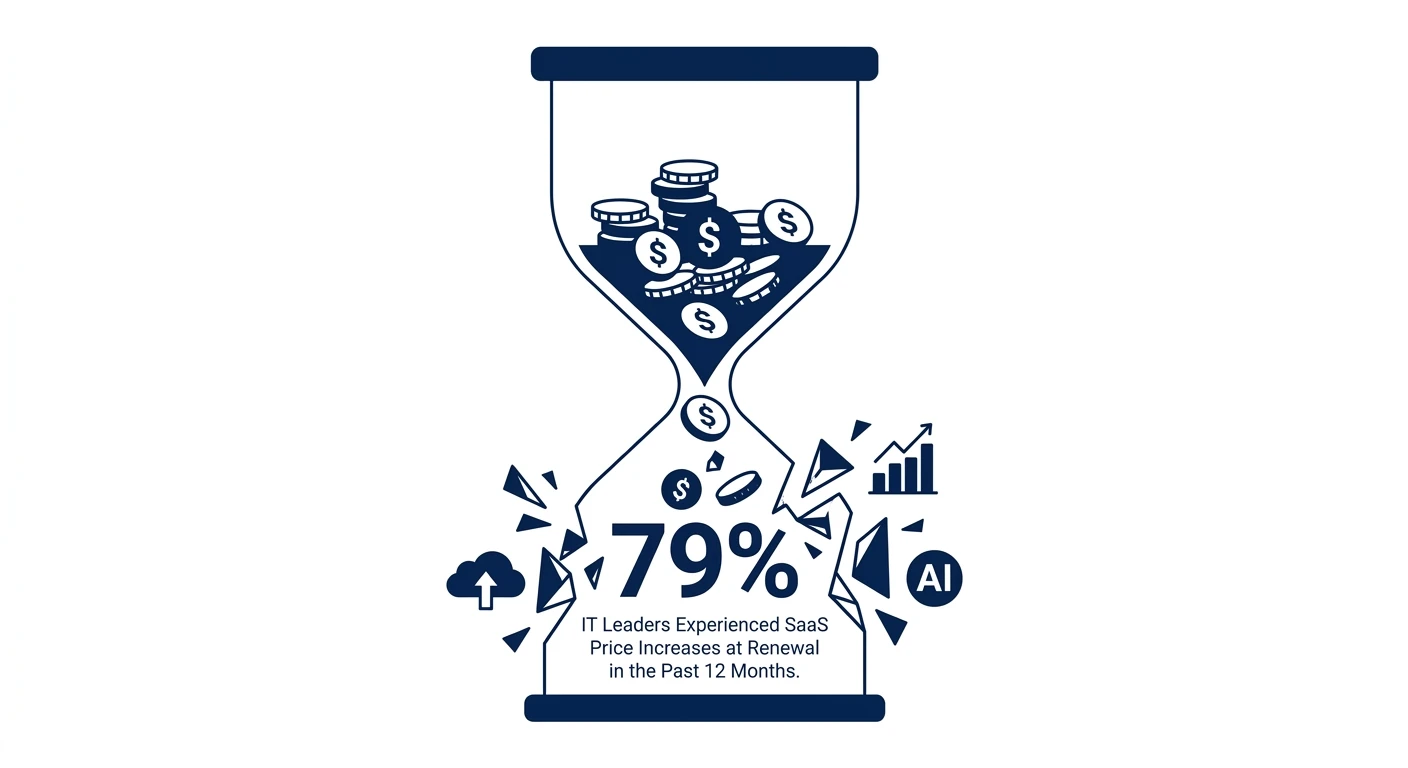
79% of IT leaders encountered SaaS price increases at renewal in the past 12 months. This is the single most disruptive budget event for IT and procurement teams — not because the amounts are always enormous, but because they’re rarely forecasted accurately.
Some documented examples of real 2025–2026 price increases:
Salesforce raised enterprise edition list prices by an average of 6% in August 2025
Microsoft 365 Business Basic is rising from $6 to $7 per user per month effective July 2026
Slack’s Business+ plan now runs $18 per user per month
These aren’t outliers. Across the market, 73% of SaaS providers raised prices by an average of 12% between 2022 and 2023, driven largely by the bundling of AI features into core plans.
The Shift to Usage-Based and Consumption Pricing
Flat monthly subscription pricing is no longer the default for high-performing SaaS companies at scale. 40% of companies with ARR above $50M now include consumption-based or outcome-based revenue in their ARR, compared to only 20–27% at smaller ARR bands.
Gartner predicts that by 2027, 70% of top SaaS vendors will offer consumption-based pricing for at least part of their portfolio. The direction of travel is clear — customers want to pay for what they use, especially as AI features add variable compute costs that don’t fit neatly into fixed subscription structures.
SaaS vendors are increasingly bundling AI functionality into core plans rather than offering it as a paid add-on. This makes pricing comparisons harder for buyers and typically results in higher average contract values for vendors.
How SaaS Companies Actually Price
39% of SaaS organizations use value-based pricing — pricing based on the outcome delivered rather than cost-plus or competitor-matching
24% simply copy their competitors’ prices — a surprisingly high number that suggests a lot of pricing is still guesswork
There’s an almost even split between companies that publish pricing (45%) and those that don’t (55%) — though transparency is trending upward
68% of SaaS companies discount in fewer than one-quarter of all deals, suggesting most maintain pricing discipline more effectively than their sales culture might suggest
SaaS Churn & Retention Statistics
Retention is quietly the most important metric in SaaS. Not CAC, not growth rate, not headcount. If your customers aren’t staying, nothing else in the model works long-term.
The Churn Benchmarks
The average annual churn rate for SaaS companies is 5.2%. For most businesses that’s a reasonable starting benchmark — but it masks enormous variation by company type, market segment, and product category.
Consumer SaaS typically churns at 3–8% monthly. B2B SaaS churns at 1–2% monthly (or 12–24% annually) for SMB customers and drops to 0.5–1% monthly for enterprise customers where switching costs are high and procurement cycles are long.
A useful mental model: improving retention by just 5% can increase long-term company valuation by 25–95%. That’s one of the highest-leverage interventions available to any SaaS business at any stage — and it costs less than almost any growth initiative.
Net Revenue Retention — The Key Metric
Net Revenue Retention (NRR) measures whether your existing customers are spending more or less over time after accounting for expansion, contraction, and churn. An NRR above 100% means your existing customer base is growing in revenue even before you add a single new customer.
From SaaS Capital’s 2026 survey:
Median NRR for bootstrapped SaaS companies with $3M–$20M ARR: 103%
90th percentile NRR for this group: 117.9%
Median NRR across all private SaaS companies: approximately 101%
From a high-performing SaaS marketing perspective, expansion ARR now represents 40% of new revenue for companies with strong retention programs. Your existing customers — not new customer acquisition — are the primary growth engine if your product is working.
Gross Revenue Retention
Gross Revenue Retention (GRR) measures how much of your existing revenue you’re keeping, excluding any expansion revenue. It’s a pure measure of churn and contraction.
Median GRR for bootstrapped SaaS companies ($3M–$20M ARR): 91%
90th percentile GRR: 100% — meaning the top performers are losing essentially no revenue from existing customers through churn or downgrades
Both NRR and GRR figures for bootstrapped companies are essentially flat year-over-year despite the growth rate decline. That’s actually a positive sign — it means the revenue base is stable even if new customer acquisition has slowed.
SaaS Customer Acquisition Statistics
Getting new customers is getting harder and more expensive. The data backs this up clearly.
The CAC Crisis
The median B2B SaaS company now spends $2.00 to acquire $1.00 of new annual recurring revenue — a 14% increase from 2023. For companies in the bottom quartile on efficiency, that number climbs to $2.82 per dollar of new ARR.
The average customer acquisition cost across B2B SaaS sits at around $1,200, though this varies significantly by segment, deal size, and how much of the sale involves human sales effort versus product-led motion.
By channel, the economics look like this:
Channel | Average CAC |
Referral programs | $150 |
Organic search (SEO) | $480–$942 |
Paid search | $802 |
Outbound sales | $1,980 |
Referral programs are the most cost-efficient acquisition channel in B2B SaaS — by a wide margin — and remain chronically underinvested compared to paid acquisition.
The SEO Opportunity
For SaaS companies specifically, SEO deserves its own section.
SEO delivers 702% ROI for B2B SaaS companies, with a break-even time of just 7 months. Organic search generates 44.6% of all B2B SaaS revenue — making it the largest single revenue channel across the industry.
Despite this, most early-stage SaaS companies dramatically underspend on organic content relative to paid acquisition — partly because SEO takes longer to show results, and partly because it’s harder to attribute precisely.
The companies that get this right early compound the advantage over years. A page that ranks #1 for a relevant search term in 2026 can generate consistent leads for three to five years with minimal additional investment.
The MQL Problem
The MQL-to-SQL conversion rate for SaaS sits at just 13% — representing the biggest bottleneck in most SaaS marketing funnels. A lot of effort goes into generating leads that sales teams never meaningfully engage with.
The average B2B customer journey takes 211 days and requires 76 touchpoints before purchase. That’s a long relationship to build before anyone signs a contract — which is why brand, content, and SEO compound so effectively over time for SaaS businesses that are patient enough to invest in them.
SaaS Spending & App Usage Statistics
How Many Apps Are Companies Actually Using?
The SaaS consolidation trend is real. Companies are using fewer apps than they were two or three years ago — but they’re paying more for the ones they keep.
The average enterprise now uses 106 SaaS applications — down from 112 in 2023 and a peak of 130 in 2022
Mid-sized companies (1,500–4,999 employees) saw the biggest drop — usage fell 29% in 2025
Large enterprises (5,000+ employees) still use the most apps on average — around 131
The average organization manages 211 SaaS renewals per year — a massive operational overhead
SaaS Spending Is Still Growing
Despite using fewer apps, companies are spending more. SaaS spending is expected to grow 20% in 2026 as vendors raise prices (especially with AI bundling) and enterprise contracts expand in scope.
95% of businesses now use SaaS in some form as part of their operations. SaaS is expected to make up 85% of all business software by the end of 2025 — the shift away from on-premise software is essentially complete for most company sizes.
47% of all venture capital is invested in SaaS startups, reflecting continued investor confidence in the model even as public market valuations have normalized from their 2021 peaks.
SaaS ARR Per Employee Benchmarks
This one doesn’t get enough attention. ARR per employee is one of the best measures of operational efficiency in a SaaS business — it tells you how much revenue the company generates relative to its headcount.
Median ARR per employee for private SaaS companies: $125,000
Enterprise SaaS companies with ARR above $20M: approximately $186,000 per employee
Early-stage companies under $1M ARR: around $50,000 per employee
The jump from $50K to $125K to $186K as companies scale reflects the operating leverage that makes SaaS such an attractive business model. The same engineering team, sales infrastructure, and customer success organization can support significantly more revenue as the customer base grows — which is why mature SaaS companies often operate at 70–80% gross margins.
SaaS Industry Outlook: What to Watch in the Next 12 Months
Based on the data trends above, here are the shifts that will matter most for SaaS businesses and buyers through the end of 2026 and into 2027.
AI monetization will separate winners from followers. Right now 41% of SaaS companies are formally monetizing AI. In 12 months that number will be significantly higher — and the companies that figured out how to price AI value effectively will have a meaningful competitive advantage over those still bundling it for free.
Renewal pressure will intensify. With 79% of IT leaders already reporting price increases at renewal, SaaS procurement is becoming a specialized function. Vendors that are transparent about pricing and deliver clear ROI before renewal will retain customers. Those that rely on switching costs alone will face growing pushback.
Consumption-based pricing will become table stakes. Gartner’s prediction that 70% of top SaaS vendors will offer consumption pricing by 2027 is looking increasingly conservative given the pace of movement already visible in 2026.
Retention beats acquisition. The CAC data makes this unavoidable — spending $2.00 to acquire $1.00 of new ARR while losing existing customers is a treadmill. The SaaS companies that build the most sustainable businesses in the next few years will be the ones that invest in customer success and expansion revenue rather than chasing net new logos at any cost.
Vertical SaaS will outperform horizontal. Growing at 31% versus 28% for horizontal, vertical SaaS has a structural advantage — deeper product fit, higher switching costs, and clearer ROI for customers in specific industries. Health, finance, and logistics are the segments with the most open opportunity.
Key Takeaways
A few numbers worth bookmarking from everything above:
The global SaaS market is worth $465 billion in 2026 and heading toward $887 billion by 2030
41% of SaaS companies are monetizing AI — the transition from AI as a feature to AI as a revenue stream is well underway
The median bootstrapped SaaS company grows at 15% — the top 10% grow at 42.3%
Good NRR is 103% at the median and 117.9% at the 90th percentile
79% of IT leaders faced renewal price hikes in the past year — pricing volatility is a real operational problem
SEO generates 44.6% of all B2B SaaS revenue and delivers 702% ROI — it’s the highest-leverage long-term channel for most SaaS companies
The average B2B customer takes 211 days and 76 touchpoints to convert — patience and consistent content compound into results
The SaaS industry in 2026 is not the same high-growth-at-any-cost environment it was in 2021. But it’s a bigger, more mature, more structurally interesting market — and the companies that understand the benchmarks, track the right metrics, and make smarter decisions about pricing, retention, and AI integration are positioned better than ever.
Conclusion
The SaaS market in 2026 is bigger, more competitive, and more AI-driven than at any point in its history. The headline number is $465 billion in global market value — but the more interesting story is in the details. Growth rates are moderating, pricing is rising, AI is moving from a nice-to-have feature to a genuine revenue line, and retention is quietly becoming more important than acquisition for most SaaS businesses.
If there are two stats worth remembering from everything above, make it these: the median B2B SaaS company spends $2.00 to acquire $1.00 of new ARR — which means the economics of paid acquisition are getting painful — and SEO delivers 702% ROI with a 7-month break-even. The channel math is not subtle.
The companies that will come out ahead in the next few years are the ones that hold onto their customers, price their AI value honestly, and build content and organic channels that compound over time rather than chasing short-term growth through expensive paid spend.
We will update this article as new benchmark data comes in through the rest of 2026.
FAQs
The global SaaS market is valued at over $270 billion as of recent estimates and is projected to surpass $1 trillion by the early 2030s. Rapid adoption across industries, cloud infrastructure growth, and digital transformation initiatives are the primary drivers behind this expansion.
The SaaS industry is growing at a compound annual growth rate (CAGR) of approximately 18-20%, making it one of the fastest-growing segments in the technology sector. Small and medium-sized businesses adopting cloud-based tools are contributing significantly to this accelerated growth rate.
Most SaaS startups fail due to poor product-market fit, high customer acquisition costs that outpace revenue, and an inability to retain subscribers long-term. Statistics show that churn rate management is one of the most critical challenges, as losing even a small percentage of customers monthly can severely impact annual recurring revenue.
Studies indicate that approximately 99% of businesses use at least one SaaS solution, with the average company now utilizing over 100 SaaS applications. Enterprise-level organizations often manage hundreds of cloud-based tools simultaneously across departments.
Yes, SaaS is generally more cost-effective because it eliminates upfront licensing fees, reduces IT infrastructure costs, and operates on a predictable subscription model. Businesses also save on maintenance, updates, and dedicated IT staff, making total cost of ownership significantly lower compared to traditional software deployments.
Comments
Be the first to leave a comment.