
CAC has been rising for five straight years. In 2026, B2B SaaS customer acquisition costs are up 40–60% since 2023. The average sales cycle is now 134 days. And the median SaaS company spends $2.00 to acquire $1 of new ARR — up 14% from the prior year.
These numbers are not abstractions. They determine whether your growth model is sustainable, how much runway you are burning on acquisition, and what investors will accept at your next raise. Here is the complete benchmark picture.
Key SaaS CAC Statistics 2026 at a Glance
Metric | Number |
CAC increase since 2023 | 40–60% |
Average B2B SaaS CAC | $702–$1,200 (depending on source/motion) |
Self-serve / product-led CAC | $702 median |
Sales-led enterprise CAC | ~$11,400 median |
Average B2B SaaS sales cycle | 134 days (up from 107 in 2022) |
Median CAC payback period (B2B) | 15–18 months |
Top-performing companies payback | 5–7 months |
Healthy LTV:CAC ratio | 3:1 minimum; 4:1–7:1 preferred |
Cost increase from iOS/cookie changes | 25–45% for laggard teams |
Referral-acquired vs paid CAC | 3–5x cheaper |
AI-driven CAC reduction (early adopters) | Up to 50% |
Expansion ARR as share of total new ARR | 40% (50%+ at $50M+ ARR) |
New CAC ratio (median spend per $1 ARR) | $2.00 |
Bottom-quartile new CAC ratio | $2.82 per $1 ARR |
What Is CAC and Why the Payback Period Matters More
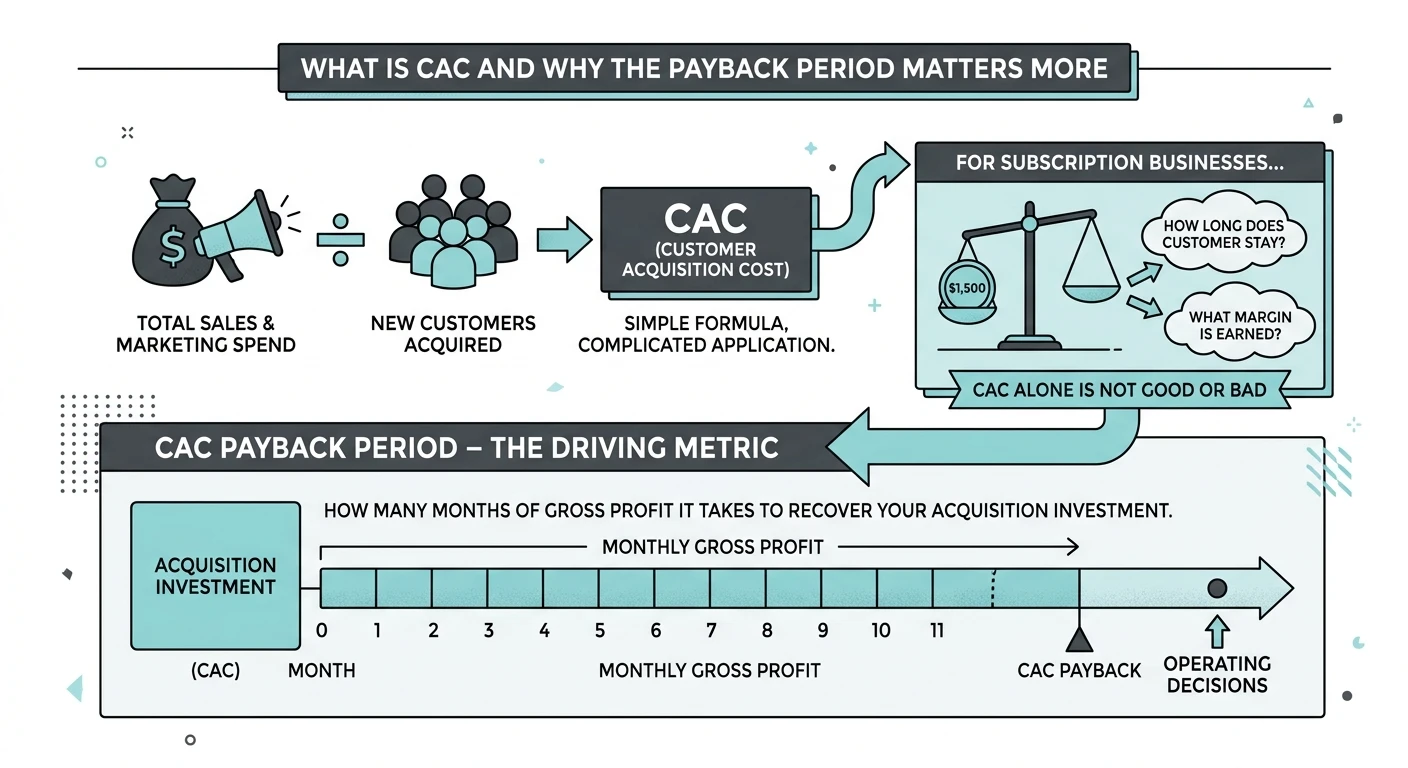
Customer acquisition cost is total sales and marketing spend divided by new customers acquired. Simple formula, complicated application.
For subscription businesses, CAC does not tell you much on its own. A $1,500 CAC is not inherently bad or good until you know how long the customer stays and what margin you earn. The metric that actually drives operating decisions is the CAC payback period — how many months of gross profit it takes to recover your acquisition investment.
CAC payback benchmarks by ARR stage (what investors actually expect):
ARR Stage | Acceptable Payback | Target Payback |
Pre-PMF (under $1M ARR) | 18–24 months | — |
Early scaling ($1M–$10M) | 14–18 months | Under 14 months |
Growth ($10M–$50M) | 12–15 months | Under 12 months |
Scale ($50M–$250M) | 10–12 months | Under 10 months |
Public / late-stage ($250M+ ARR) | 9–12 months | Under 9 months |
Under 12 months is generally considered strong for B2B SaaS. Under 18 months is acceptable. These thresholds have hardened from preferences into hard covenants in most 2025–2026 SaaS term sheets.
CAC by Customer Segment and Motion
The 16x gap between self-serve and enterprise sales-led CAC is the widest it has ever been.
Motion / Segment | Median CAC | Payback |
Self-serve / product-led | $702 | 8–12 months |
Sales-assisted SMB | $1,200–$2,500 | 12–18 months |
Mid-market sales-led | $3,000–$6,000 | 14–20 months |
Enterprise sales-led | ~$11,400 | 18–24 months |
Outbound only | ~$1,980 | Varies |
Enterprise CAC climbed 9% since 2024 driven by longer sales cycles, more stakeholders per deal, and rising SDR compensation. The average B2B SaaS sales cycle now spans 134 days, up from 107 days in early 2022.
Outbound CAC of ~$1,980 is not a reason to avoid outbound — for enterprise products with high ACV, the LTV justifies the investment. But for SMB-focused products with ACVs under $5,000, outbound economics rarely work without very high conversion rates or a strong product-led assist motion.
CAC by Acquisition Channel
Not all acquisition spend works equally. The gap between the best and worst channels is enormous.
Channel | Typical CAC | Notes |
Referrals | $141–$200 | Most cost-efficient, consistently |
Organic / SEO / content | $500–$1,500 | Higher upfront, best long-term ROI |
Paid search (PPC/SEM) | ~$802 | Requires ongoing investment |
Outbound sales | ~$1,980 | Highest CAC, justified at high ACV |
Events / conferences | Variable | Hard to attribute, often underestimated |
Key channel insights:
Referred customers are 3–5x cheaper to acquire than paid channel customers
Referral programs reduce blended CAC by 35–45% when they account for 20%+ of acquisition
Companies that add a referral channel see overall CAC decrease by 15–25% within the first year
iOS privacy changes and cookie deprecation are driving 25–40% CAC increases for teams still relying on legacy tracking
Teams with server-side measurement and AI-assisted creative are paying less per acquired customer than in 2024 — creating a measurement maturity gap between leaders and laggards
CAC by Industry Vertical
Industry context matters significantly. A $700 CAC is catastrophic in e-commerce and completely normal in financial services.
Vertical | SMB CAC | Notes |
Fintech SaaS | $1,461 | Regulatory complexity justifies |
Cybersecurity SaaS | $1,000–$1,400 | Enterprise traction required |
HR Tech | $800–$1,200 | Long sales cycles |
Marketing Tech | $500–$900 | Crowded, competitive |
E-commerce SaaS | $299 | Lowest SMB CAC |
B2B SaaS overall | $702–$1,200 | Wide range by segment |
The Unit Economics Framework: LTV:CAC
CAC payback is the operating metric. LTV:CAC is the investor metric. Both matter.
LTV:CAC benchmarks:
Minimum acceptable: 3:1
Target for most SaaS: 4:1–7:1
Series A companies average: 3:1 (improving with maturity)
Companies where LTV:CAC is high: high-ACV enterprise with low churn
The math: if your CAC is $1,000 and your LTV is $3,000, you have a 3:1 ratio. Every dollar invested in acquisition returns $3 of lifetime value. Below 3:1, acquisition becomes economically questionable at scale. Above 5:1, you are likely underinvesting in growth relative to what the market can return.
What destroys LTV:CAC:
High churn eating the denominator
High CAC relative to ARPU
Long sales cycles with high SDR costs
Wrong ICP — buying the wrong customers at high cost
The AI Effect on CAC: Two Different Outcomes
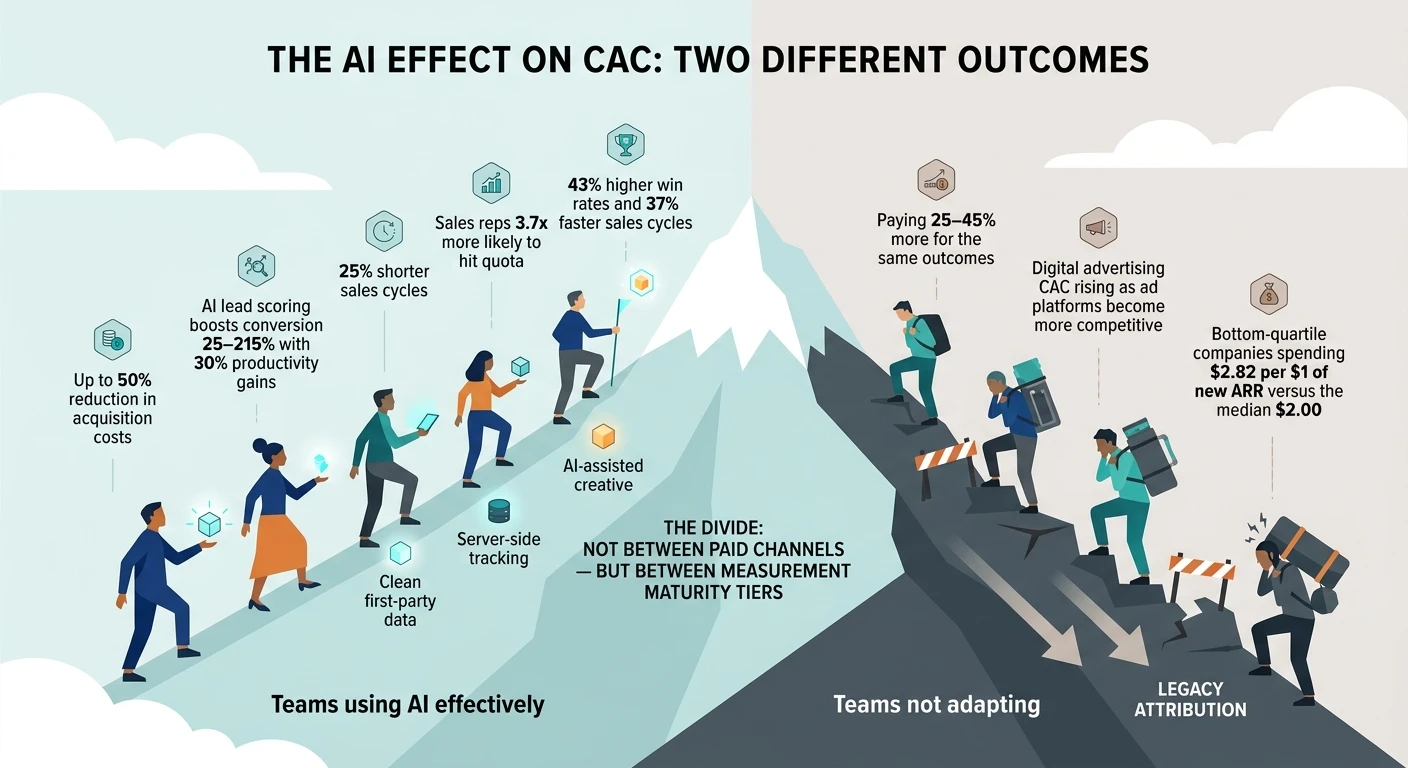
AI is doing something unusual to CAC — it is widening the gap between efficient and inefficient teams rather than uniformly changing the metric.
Teams using AI effectively:
Up to 50% reduction in acquisition costs (early adopter data)
AI lead scoring boosts conversion 25–215% with 30% productivity gains
25% shorter sales cycles
Sales reps using AI are 3.7x more likely to hit quota
Teams using AI sales tools see 43% higher win rates and 37% faster sales cycles
Teams not adapting:
Paying 25–45% more for the same outcomes as measurement standards changed
Digital advertising CAC rising as ad platforms become more competitive
Bottom-quartile companies spending $2.82 per $1 of new ARR versus the median $2.00
The divide is not between paid channels — it is between measurement maturity tiers within every channel. Teams with clean first-party data, server-side tracking, and AI-assisted creative are operating in a different economics environment than teams still relying on legacy attribution.
Expansion ARR: The CAC You Are Not Counting
The most significant CAC insight in 2026 is how much of “new” revenue is actually coming from existing customers.
Expansion ARR represents 40% of total new ARR at the median
At $50M+ ARR, expansion accounts for over 50% of new ARR
Acquiring new customers costs 5–25x more than retaining and expanding existing ones
CAC payback period has increased 12.5% at median since 2022
The implication: at scale, your most efficient growth engine is your existing customer base. Companies with high NRR (110%+) can grow 2.3x faster than peers at 95–100% NRR — without acquiring a single new customer. Investment in customer success is not overhead; it is the cheapest acquisition motion available.
FAQs
Under 12 months is considered strong, while under 18 months is acceptable. Investor standards have tightened significantly since 2022, and a 24-month payback period that was once tolerated is now treated as a yellow flag during due diligence.
SaaS CAC has risen 40–60% due to three converging forces: more competitive ad platforms, longer sales cycles averaging 134 days, and previously low-cost channels becoming overcrowded. iOS privacy changes and cookie deprecation have compounded the problem for teams still relying on legacy measurement tools.
Referrals are the lowest-cost channel at $141–$200 per customer, followed by organic content and SEO at $500–$1,500 with the best long-term ROI. Building a structured referral programme that runs at 10–15% of equivalent paid acquisition spend offers the highest leverage for reducing overall CAC.
Outbound makes economic sense when your annual contract value is high enough to justify the $1,980 median outbound CAC. For ACVs above $25,000 outbound is often essential, but for ACVs below $5,000 the economics are difficult without a strong product-led growth motion supporting the effort.
AI reduces CAC through better lead scoring, AI-assisted creative that lowers cost-per-click on paid channels, and automated SDR workflows that cut the per-outreach cost of outbound. Early adopters are reporting up to 50% CAC reductions, driven primarily by improved lead qualification and creative optimisation rather than headcount cuts.
Comments
Be the first to leave a comment.