
If you have searched for the size of the SaaS market recently you have probably noticed that different sources give wildly different numbers — anywhere from $250 billion to $600 billion depending on who you ask and what they are counting. The variation is not because anyone is making numbers up. It is because the SaaS market is genuinely hard to define cleanly at the edges and different analysts use different methodologies.
This article pulls together the most current market size data available in 2026, explains where the numbers come from, breaks down the market by region and segment, and gives you the clearest picture available of where the industry is now and where it is heading. All figures sourced from primary research and analyst reports published in 2025 and 2026.
Here is the full picture.
Global SaaS Market Size in 2026
The Headline Number
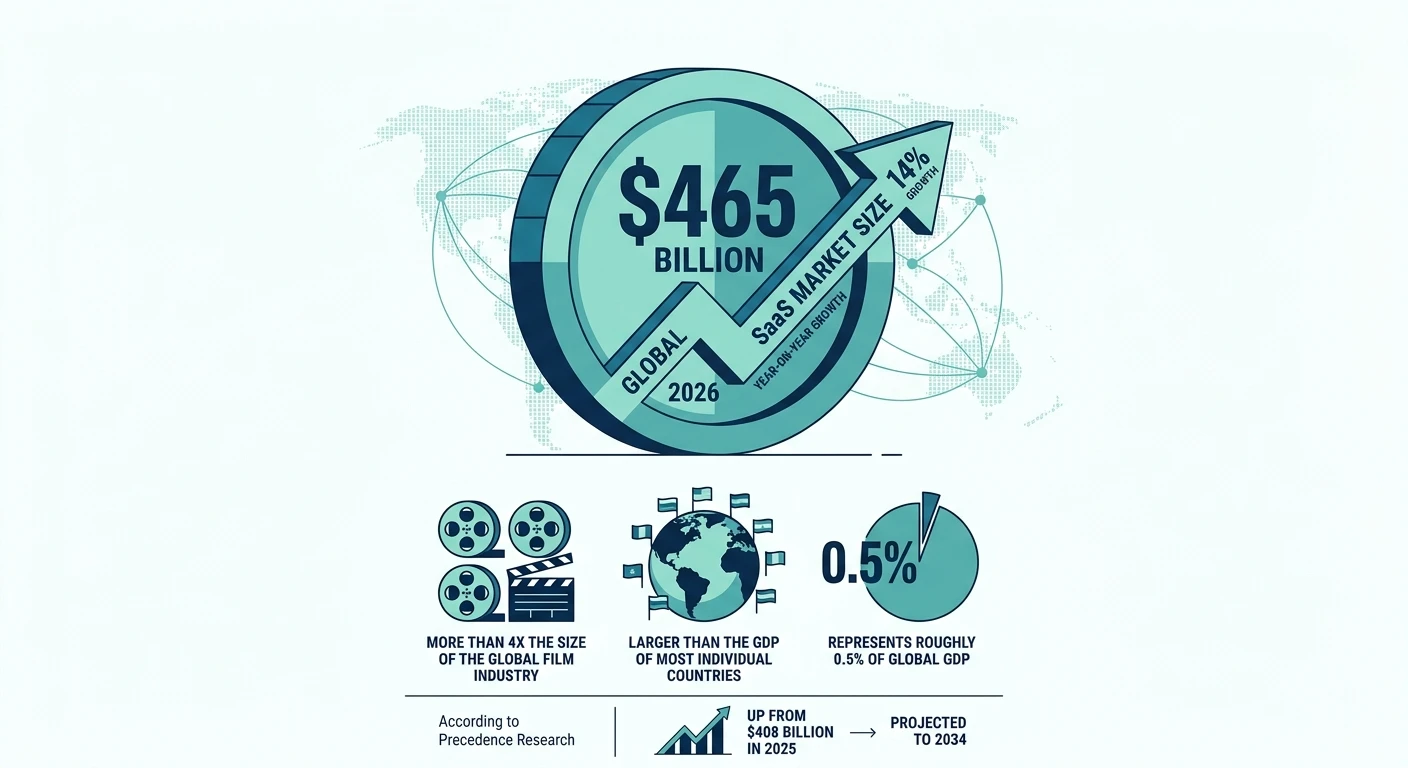
The global SaaS market reached $465 billion in 2026, according to Precedence Research — up from $408 billion in 2025. That represents year-on-year growth of approximately 14%, which is broadly consistent with the long-term compound annual growth rate projected for the industry through 2034.
To put $465 billion in context:
It is more than four times the size of the global film industry
It is larger than the GDP of most individual countries
It represents roughly 0.5% of global GDP — an extraordinary share for a single software delivery model that did not meaningfully exist before the early 2000s
Other analyst estimates for 2026 range from $317 billion (more conservative methodology) to $500 billion (broader definition of cloud software). The $465 billion figure from Precedence Research sits in the middle of the range and is one of the most widely cited in current industry reporting.
How Fast Is the SaaS Market Growing?
The long-term growth rate for the global SaaS market is projected at 13.32% CAGR through 2034. That is a sustained, consistent growth rate for an industry that is already measured in the hundreds of billions — which is unusual and reflects the structural advantages of the SaaS delivery model over on-premise software alternatives.
Year-by-year, the trajectory looks like this:
Year | Projected Market Size |
2025 | $408 billion |
2026 | $465 billion |
2027 | ~$527 billion |
2028 | ~$597 billion |
2029 | ~$793 billion (some forecasts) |
2030 | ~$887 billion |
2032 | ~$1.1 trillion |
2034 | ~$1.25 trillion |
2035 | ~$1.37 trillion |
The jump in 2029 in some forecasts reflects AI-driven acceleration — several analysts project that AI integration will meaningfully expand the addressable market beyond what simple extrapolation of current trends would suggest.
SaaS Market Size by Region
North America Still Leads — But the Gap Is Narrowing
North America is the largest SaaS market in the world by a significant margin. By 2026, the North American SaaS market is estimated at $211.7 billion — representing approximately 46% of the global market.
The U.S. dominates within North America. It is home to 17,000 SaaS companies — 8.5 times more than the UK, the country with the second-highest number. U.S.-based SaaS companies serve nearly 14 billion users worldwide — a figure that reflects how deeply American SaaS platforms are embedded in global business infrastructure at every level.
The U.S. SaaS market specifically is projected to surpass $412 billion by 2034, tracking closely with global market trends and maintaining its leadership position despite growing competition from European and Asian SaaS companies.
Europe
Europe is the second-largest SaaS region and growing fast — driven by digital transformation across both enterprise and public sector, strong regulatory frameworks that are actually accelerating SaaS adoption in some cases (GDPR compliance is easier with cloud-delivered software than on-premise), and a maturing startup ecosystem producing more homegrown SaaS companies.
The UK has 1,800 SaaS companies — the most in Europe and the second most in the world. Germany, France, and the Netherlands are the other major European SaaS hubs.
Asia-Pacific
Asia-Pacific is the fastest-growing SaaS region globally — starting from a smaller base but expanding rapidly as enterprise cloud adoption accelerates across Japan, Australia, Singapore, and India. India in particular is producing a significant number of SaaS companies targeting global markets — with companies like Freshworks, Zoho, and Chargebee establishing India as a credible SaaS exporter rather than just a services market.
How Many SaaS Companies Exist in 2026?
The Global Count
There are over 30,800 SaaS companies globally as of 2026 — up 23% from approximately 25,000 in 2021. Predictions suggest this number could reach 72,000 companies as the model continues to expand into new verticals and geographies.
The breakdown by country:
Country | Number of SaaS Companies |
United States | 17,000 |
United Kingdom | 1,800 |
Canada | ~900 |
Germany | ~800 |
Australia | ~700 |
India | ~600 |
France | ~500 |
Rest of World | ~9,500 |
The U.S. concentration is extraordinary — more than half of all SaaS companies in the world are American. This reflects the head start Silicon Valley had in building cloud software infrastructure, the depth of U.S. venture capital markets, and the scale of the domestic market that allows American SaaS companies to achieve significant revenue before needing to expand internationally.
What Most SaaS Companies Look Like
The popular image of a SaaS company is a unicorn with a billion-dollar valuation and hundreds of employees. The reality is very different.
The average SaaS company has around 36,000 customers — but this average is heavily skewed by a handful of giants. Most SaaS companies serve far fewer customers at higher price points. The median B2B SaaS company has somewhere between 100 and 500 customers and an ACV of $5,000 to $50,000.
The most crowded SaaS categories in 2026 are:
Productivity and collaboration tools
CRM and sales automation
Marketing automation and email
HR and payroll software
Project management and workflow tools
Security and compliance
These categories are competitive to the point of commoditization in some cases — which is why the data consistently shows vertical SaaS growing faster than horizontal as new companies look for less crowded markets with deeper product-fit opportunities.
SaaS Adoption Statistics — How Widely Is It Used?
Enterprise and Business Adoption
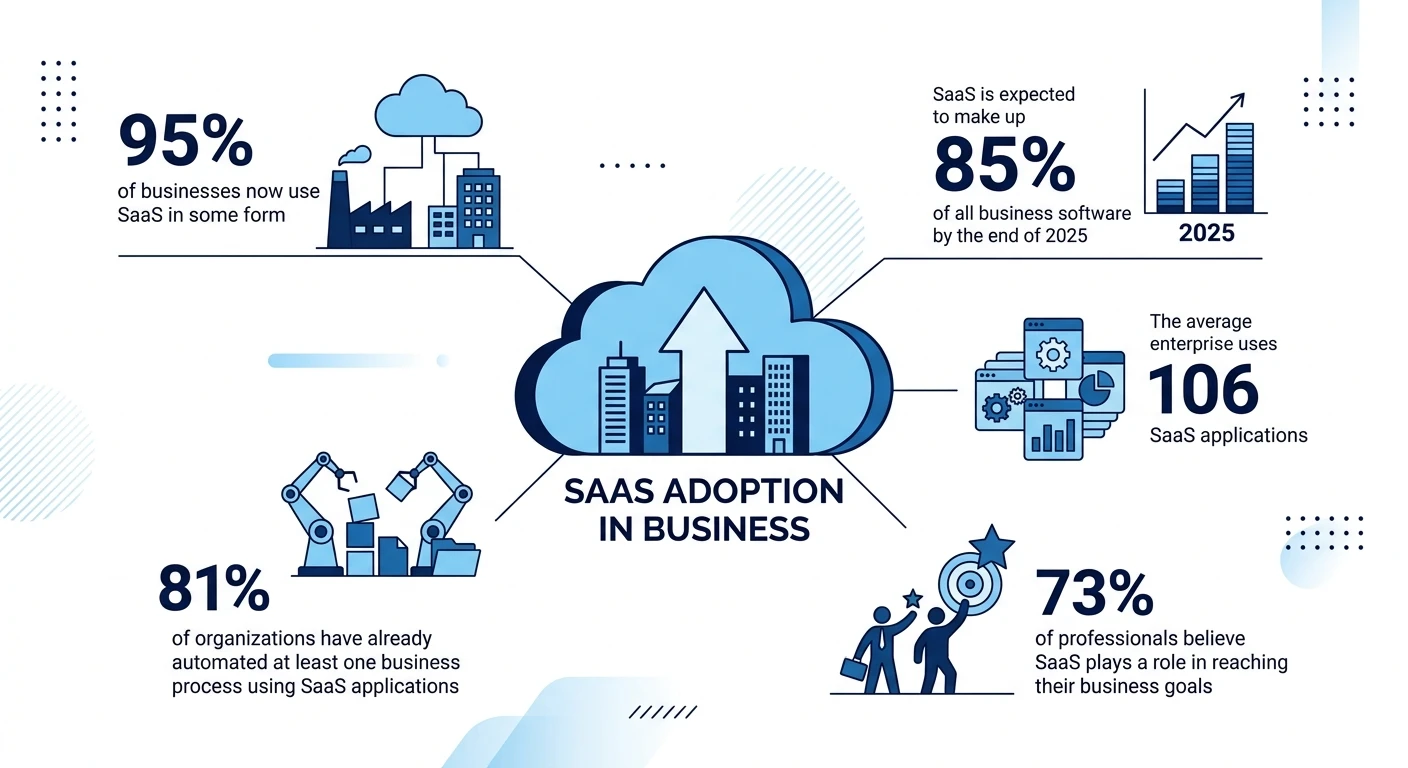
95% of businesses now use SaaS in some form as part of their operations — adoption is essentially universal
SaaS is expected to make up 85% of all business software by the end of 2025 — the shift away from on-premise is effectively complete for most company sizes
The average enterprise uses 106 SaaS applications — down from 130 in 2022 as consolidation accelerates but still a substantial operational footprint
81% of organizations have already automated at least one business process using SaaS applications
73% of professionals believe SaaS plays a role in reaching their business goals — ranking it as the top technology driving business success above big data, AI tools, and everything else surveyed
The On-Premise to SaaS Shift
The migration from on-premise software to SaaS is one of the defining business technology stories of the last 15 years — and it is largely complete for most categories. About 75% of apps are now SaaS with around 25% still on-premise, primarily in regulated industries and large enterprises with specific data sovereignty requirements.
The remaining on-premise holdouts are concentrated in:
Healthcare and life sciences (regulatory and data sensitivity requirements)
Financial services and banking (compliance and data sovereignty)
Government and defence (security classification requirements)
Large manufacturing (operational technology integration complexity)
Even in these sectors, hybrid architectures are becoming the norm — with some workloads moving to SaaS while others remain on-premise for specific compliance reasons.
The SaaS Market by Vertical
Not all SaaS markets are growing at the same rate. Some verticals are significantly outpacing the overall market average.
Healthcare SaaS
The health cloud SaaS market is projected to reach $452.4 billion by 2029, growing at a CAGR of approximately 26% — double the rate of the overall SaaS market. This is being driven by electronic health record digitization, telehealth infrastructure expansion, AI-assisted diagnostics, and compliance management tools across the healthcare system.
FinTech SaaS
Financial services SaaS is one of the largest and most competitive vertical markets. Revenue from AI data services for Machine Learning Operations tools in financial services is projected to nearly quadruple between 2024 and 2028. The combination of regulatory complexity, data intensity, and the high cost of legacy financial infrastructure creates significant opportunity for SaaS solutions.
Marketing SaaS
The marketing SaaS segment alone — covering marketing automation, CRM, email marketing, and analytics — is valued at tens of billions and growing at 15–20% annually. By 2025, companies were spending over $20 billion per year on marketing SaaS tools globally. This is one of the most mature SaaS categories and also one of the most competitive.
AI as a SaaS Vertical
Increasingly, AI itself is becoming a SaaS market rather than just a feature of existing SaaS products. The global AI SaaS market is expected to grow at 38.28% CAGR from 2023 to 2031, reaching approximately $775 billion by 2031 — which at that point would be larger than the entire current SaaS market. The leading SaaS sectors in 2026 are AI, data analytics, and financial services, with around 4,300 companies operating across these three areas.
SaaS Spending Statistics
Total Spend and Growth
SaaS spending is expected to grow 20% in 2026 — a meaningful acceleration driven by AI feature bundling, price increases, and new category adoption
47% of all venture capital is invested in SaaS startups — reflecting continued investor confidence in the model
The SaaS industry attracted over $90 billion in venture funding in 2023 — and while funding has moderated from 2021 peaks, it remains substantial
Spending Per Organization
The average large enterprise is spending significantly more on SaaS than it was three years ago — even if it is using fewer individual applications. This reflects two trends working simultaneously: consolidation (buying fewer tools) and price increases (paying more for the ones they keep).
The average organization manages 211 SaaS renewals per year — which means procurement teams are essentially in a constant cycle of renewal negotiations, vendor evaluations, and contract management alongside whatever their primary job function is.
SaaS Market Efficiency Statistics
Revenue Per Employee
One of the clearest indicators of the SaaS model’s economic efficiency is revenue per employee — how much revenue each person in the organization generates.
Median ARR per employee for private SaaS companies: $125,000
Enterprise SaaS companies with ARR above $20M: approximately $186,000 per employee
Early-stage companies under $1M ARR: around $50,000 per employee
The jump from $50K to $186K as companies scale reflects the operating leverage built into the SaaS model. The same engineering team and infrastructure can support ten times as many customers as the company grows — which is why mature SaaS businesses operate at gross margins of 70–80% compared to 20–30% for most traditional software businesses.
Gross Margins
SaaS gross margins are significantly higher than most other software business models:
SaaS Segment | Typical Gross Margin |
Pure SaaS (no services) | 70–85% |
SaaS with significant services | 55–70% |
Usage-based SaaS with AI compute | 60–75% |
Infrastructure SaaS | 50–65% |
The AI compute cost issue is worth noting here. As AI features become more central to SaaS products, the compute costs associated with model inference are putting mild downward pressure on gross margins — particularly for products with heavy AI usage. This is one reason why usage-based pricing for AI features is growing — it allows vendors to pass variable compute costs through to heavy users rather than absorbing them into a fixed gross margin.
Where the SaaS Market Is Heading
Near-Term (2026–2028)
The next two years will be defined by AI integration, pricing evolution, and consolidation. The total number of SaaS companies will continue to grow but the market share will concentrate — the best-funded and best-product companies in each category will pull further ahead as switching costs rise and enterprise procurement becomes more selective.
Usage-based pricing will become significantly more common — moving from a differentiator to an expectation in many categories, particularly those with AI-heavy feature sets.
Medium-Term (2028–2030)
By 2030 the global SaaS market is projected to reach $887 billion — nearly doubling from 2026 levels. The growth will come disproportionately from AI-native SaaS products, vertical market expansion, and continued adoption in Asia-Pacific and emerging markets.
By 2028, more than 50% of enterprise businesses will rely on industry cloud platforms — specialized vertical SaaS environments that combine software, data, and AI for specific industries. This represents a structural evolution beyond the current horizontal SaaS model into something more integrated and more defensible.
Long-Term (2030–2035)
The $1.37 trillion projection for 2035 assumes continued AI-driven market expansion — essentially that AI will expand the total addressable market for software by enabling categories and use cases that did not previously exist as software products. The line between “software company” and “AI company” will become increasingly blurred, and the SaaS delivery model will remain the dominant vehicle for both.
Conclusion
The SaaS market in 2026 is a $465 billion industry growing at 13–14% per year with 30,800 companies competing for a share of enterprise and SMB software budgets that are themselves growing at 20% annually. The fundamentals are strong — adoption is near-universal, margins are healthy, and the transition from on-premise software is effectively complete across most market segments.
The interesting story is not the headline market size number — it is the composition of the growth. AI is expanding the market faster than traditional SaaS metrics would predict. Vertical specialization is outperforming horizontal generalisation. And the geographic concentration in the U.S. is gradually but meaningfully eroding as European and Asian SaaS ecosystems mature.
For founders, buyers, and investors trying to understand where the market is heading — the $887 billion 2030 projection is a useful anchor. The SaaS market will roughly double in four years. The question is not whether it will grow but which products, business models, and geographies will capture the most of that growth.
We will update this article as new market data becomes available through the rest of 2026.
FAQs
The global SaaS market is valued at over $270 billion as of 2023 and continues to grow rapidly. Analysts project it could surpass $1 trillion by the early 2030s driven by cloud adoption and digital transformation.
The SaaS industry is growing at a compound annual growth rate (CAGR) of approximately 18-20%. This makes it one of the fastest-growing segments within the broader technology sector.
Yes, the SaaS market remains highly attractive for new entrants due to its expanding size and recurring revenue model. Niche verticals and underserved industries still offer significant growth potential for startups.
The SaaS market is growing because businesses increasingly prefer subscription-based software over costly on-premise solutions. Factors like remote work adoption, scalability, and lower upfront costs make SaaS an appealing choice for companies of all sizes.
North America currently dominates the SaaS market, accounting for the largest share of global revenue. However, Asia-Pacific is emerging as the fastest-growing region due to rapid digitalization and increasing cloud infrastructure investment.
Comments
Be the first to leave a comment.