
Personalization has transformed from a nice-to-have feature to a critical business strategy.
Companies that deliver personalized experiences see dramatically higher engagement, conversion rates, and customer lifetime value.
This comprehensive guide reveals personalization adoption rates, ROI data, consumer expectations, and trends shaping 2026.
Personalization Market Overview
The personalization technology market continues explosive growth as businesses recognize its revenue impact.
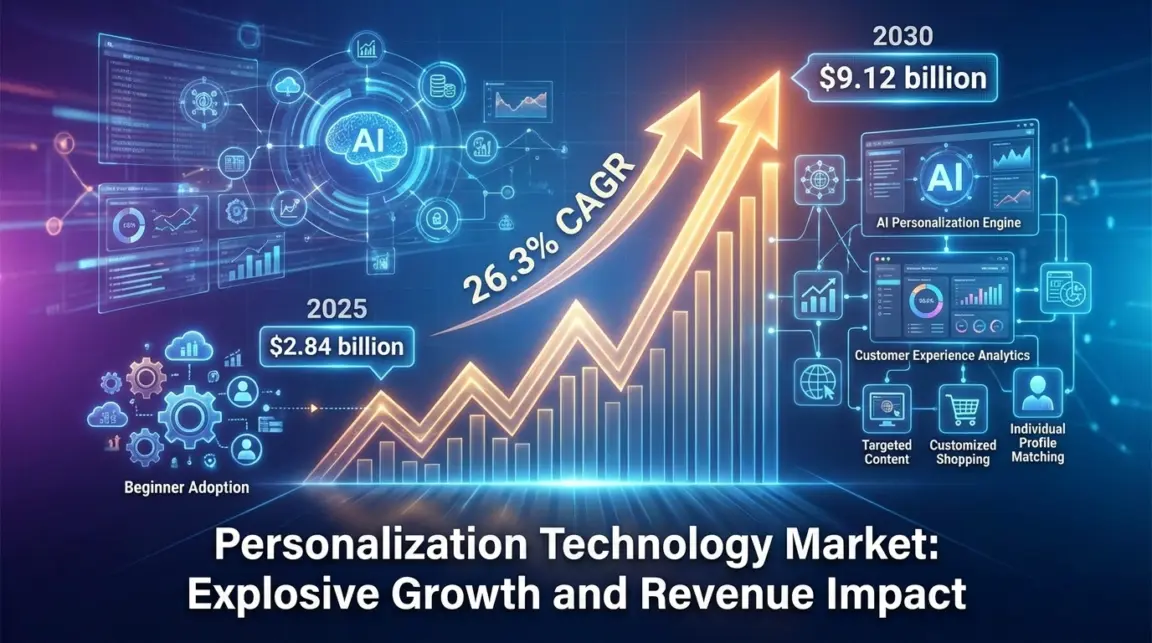
- Global personalization software market (2025): $2.84 billion
- Projected market size (2030): $9.12 billion
- Compound annual growth rate (CAGR): 26.3%
- Companies using personalization: 88%
The personalization market reached $2.84 billion in 2025 and grows at 26.3% annually. 88% of companies now implement some form of personalization in their customer experience.
Personalization Adoption Timeline
Personalization evolved from basic name insertion to AI-driven real-time customization.
| Year | Market Size (Billion $) | Adoption Rate | Key Milestone |
| 2017 | 0.48 | 42% | Email personalization dominant |
| 2019 | 0.86 | 58% | Website personalization grows |
| 2021 | 1.52 | 72% | AI personalization emerges |
| 2023 | 2.18 | 82% | Omnichannel personalization |
| 2024 | 2.48 | 85% | Real-time personalization |
| 2025 | 2.84 | 88% | Predictive personalization |
| 2026 | 3.42 | 91% | Hyper-personalization |
The market has grown from $480 million in 2017 to $3.42 billion projected for 2026. That’s 612% growth in nine years.
Consumer Expectations for Personalization
Modern consumers don’t just appreciate personalization—they demand it. Expectations have risen dramatically.
- Consumers expecting personalized experiences: 71%
- Consumers frustrated by impersonal experiences: 76%
- Consumers more likely to buy with personalization: 80%
- Consumers willing to share data for personalization: 63%
71% of consumers now expect companies to deliver personalized interactions. 76% feel frustrated when experiences aren’t tailored to their preferences.
Also read about: Coupon Statistics
What Consumers Consider Personalized
Consumer definitions of personalization:
| Personalization Type | Consumers Who Value It | Impact on Purchase |
| Product recommendations | 84% | +38% conversion |
| Personalized emails | 72% | +26% open rate |
| Website content customization | 68% | +42% engagement |
| Special offers based on history | 78% | +52% redemption |
| Remembering preferences | 82% | +34% loyalty |
| Personalized search results | 64% | +28% satisfaction |
| Dynamic pricing | 38% | -12% trust |
Product recommendations top consumer preferences at 84%. Remembering preferences (82%) and special offers based on purchase history (78%) follow closely.
Consumer Frustrations with Poor Personalization
Top personalization failures that annoy consumers:
- Irrelevant product recommendations: 68%
- Asking for information already provided: 64%
- Generic “Dear Customer” emails: 58%
- Showing sold-out items repeatedly: 52%
- Irrelevant content on homepage: 48%
- Push notifications unrelated to interests: 72%
72% of consumers find irrelevant push notifications extremely annoying. 68% dislike seeing completely irrelevant product recommendations.
Personalization ROI and Business Impact
Personalization delivers measurable revenue increases and efficiency gains across industries.
Revenue Impact Statistics
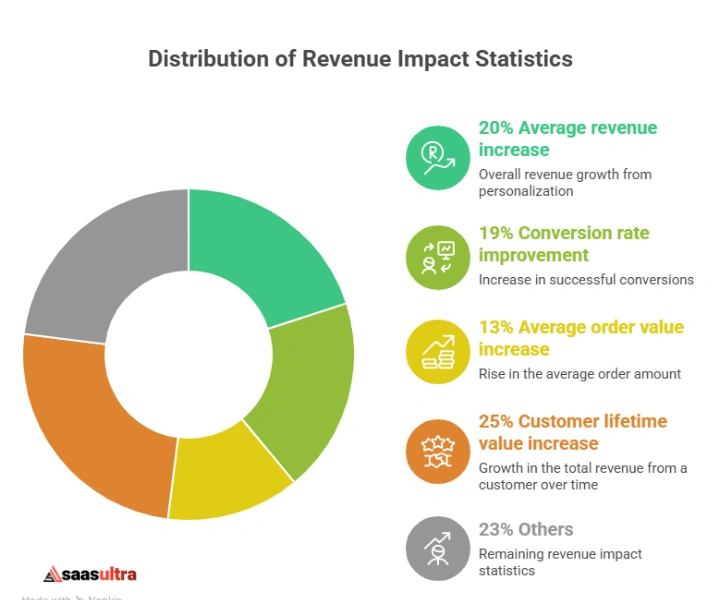
- Average revenue increase from personalization: 20%
- Companies reporting positive ROI: 89%
- Conversion rate improvement: 19%
- Average order value increase: 13%
- Customer lifetime value increase: 25%
Companies implementing personalization see 20% average revenue increases. 89% report positive ROI from their personalization investments.
Revenue impact by personalization type:
| Personalization Method | Revenue Lift | Implementation Rate |
| Email personalization | 26% | 92% |
| Product recommendations | 38% | 78% |
| Website personalization | 19% | 68% |
| Personalized search | 24% | 54% |
| Dynamic content | 31% | 62% |
| Behavioral targeting | 42% | 58% |
Behavioral targeting delivers the highest revenue lift at 42%, followed by product recommendations at 38%.
Conversion Rate Improvements
- Average conversion rate increase: 19%
- Landing page conversion boost: 25%
- Email conversion improvement: 26%
- Cart abandonment reduction: 14%
Personalization improves overall conversion rates by 19% on average. Email personalization shows 26% conversion improvements.
Conversion metrics by industry:
| Industry | Avg. Conversion Increase | Top Performing Channel |
| E-commerce | 28% | Product recommendations |
| SaaS | 22% | Personalized demos |
| Financial Services | 18% | Customized offers |
| Healthcare | 16% | Tailored content |
| Travel | 34% | Dynamic packages |
| Education | 24% | Course recommendations |
Travel sees the highest conversion lift at 34%, while healthcare shows more modest 16% improvements.
Email Personalization Statistics
Email remains the most widely adopted personalization channel with proven results.
Email Personalization Adoption
- Companies personalizing emails: 92%
- Average open rate increase: 26%
- Average click-through rate increase: 14%
- Revenue per email increase: 58%
92% of companies personalize emails in some form. Personalized emails generate 26% higher open rates and 58% more revenue per email.
Email personalization tactics used:
| Tactic | Adoption Rate | Effectiveness Score |
| Recipient name in subject line | 88% | 7.2/10 |
| Content based on past purchases | 64% | 8.8/10 |
| Dynamic product recommendations | 58% | 9.2/10 |
| Location-based content | 48% | 7.8/10 |
| Behavior-triggered emails | 72% | 8.6/10 |
| Send time optimization | 42% | 8.4/10 |
Dynamic product recommendations score highest effectiveness (9.2/10) despite only 58% adoption. Name personalization is most common (88%) but less effective (7.2/10).
Advanced Email Personalization Results
Personalized subject lines performance:
- Open rate improvement: 26%
- Click rate improvement: 14%
- Unsubscribe rate reduction: 18%
Behavior-triggered emails performance:
- Open rates: 42% (vs. 18% batch emails)
- Click rates: 8.4% (vs. 2.6% batch emails)
- Conversion rates: 4.8% (vs. 1.2% batch emails)
Behavior-triggered emails dramatically outperform batch sends across all metrics.
Website Personalization Statistics
Personalizing website experiences drives engagement and conversions significantly.
Website Personalization Adoption
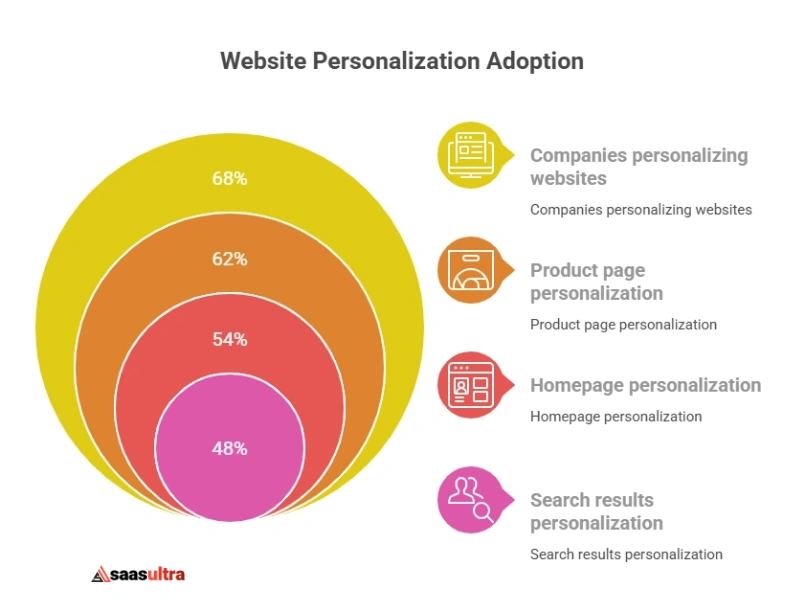
- Companies personalizing websites: 68%
- Homepage personalization: 54%
- Product page personalization: 62%
- Search results personalization: 48%
68% of companies personalize website experiences in some capacity. Product pages (62%) see more personalization than homepages (54%).
Website personalization elements:
| Element | Implementation Rate | Conversion Impact |
| Product recommendations | 78% | +38% |
| Dynamic homepage content | 54% | +24% |
| Personalized banners | 48% | +18% |
| Geo-targeted content | 62% | +22% |
| Returning visitor recognition | 72% | +31% |
| Personalized search | 44% | +28% |
Product recommendations show highest adoption (78%) and strong conversion impact (+38%).
Website Personalization ROI
- Average website conversion increase: 19%
- Engagement time increase: 34%
- Bounce rate reduction: 22%
- Pages per session increase: 28%
Website personalization increases conversions by 19% while boosting engagement time by 34%.
Personalization impact by website section:
- Homepage: +24% engagement
- Product pages: +38% conversions
- Search results: +28% click-through
- Cart page: +14% completion rate
- Blog/content: +42% time on page
Mobile App Personalization Statistics
Mobile apps offer rich personalization opportunities through device data and behavior tracking.
- Mobile apps using personalization: 76%
- In-app engagement increase: 42%
- App retention improvement: 36%
- Push notification effectiveness boost: 58%
76% of mobile apps implement personalization features. These apps see 42% higher engagement and 36% better retention.
Mobile personalization features:
- Personalized push notifications: 82%
- Customized home screens: 64%
- Behavior-based recommendations: 72%
- Location-based offers: 58%
- User preference settings: 88%
Personalized push notifications achieve 58% higher click-through rates than generic notifications.
E-commerce Personalization Statistics
Online retail leads personalization adoption and sees the strongest measurable impact.
E-commerce Personalization Adoption
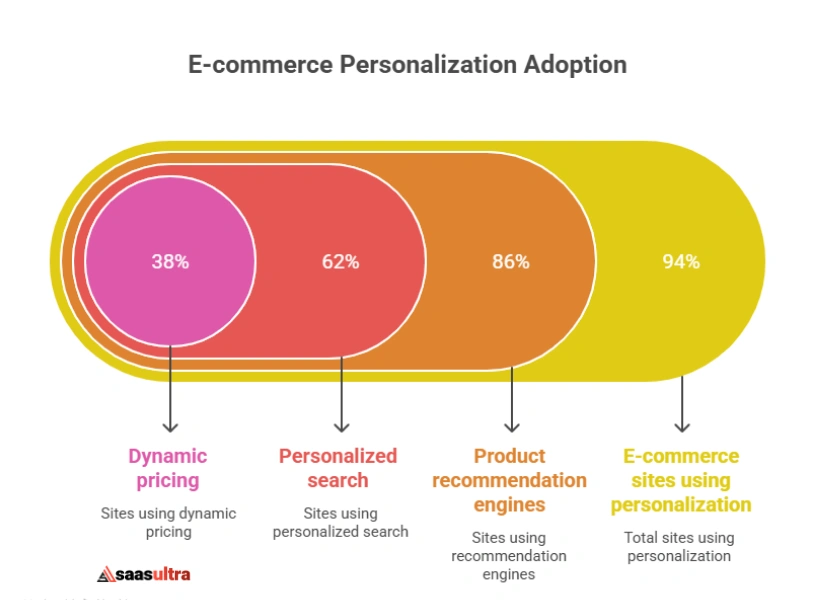
- E-commerce sites using personalization: 94%
- Product recommendation engines: 86%
- Personalized search: 62%
- Dynamic pricing: 38%
94% of e-commerce sites implement some personalization. Product recommendations are nearly universal at 86% adoption.
E-commerce personalization ROI:
| Metric | Without Personalization | With Personalization | Improvement |
| Conversion Rate | 2.4% | 3.8% | +58% |
| Average Order Value | $86 | $118 | +37% |
| Revenue per Visitor | $2.06 | $4.48 | +117% |
| Cart Abandonment | 69% | 54% | -22% |
| Customer Retention | 38% | 64% | +68% |
Personalization more than doubles revenue per visitor in e-commerce from $2.06 to $4.48.
Product Recommendation Performance
- Sites using product recommendations: 86%
- Revenue from recommendations: 31% of total e-commerce revenue
- Click-through rate on recommendations: 12.4%
- Conversion rate from recommendations: 5.8%
Product recommendations drive 31% of total e-commerce revenue despite occupying minimal page space.
Recommendation types and performance:
| Recommendation Type | Usage Rate | Conversion Rate |
| “Customers also bought” | 92% | 6.2% |
| “Similar items” | 84% | 4.8% |
| “Trending now” | 68% | 5.4% |
| “Based on browsing history” | 76% | 7.6% |
| “Complete the look” | 54% | 8.2% |
“Complete the look” recommendations convert highest at 8.2%, while “Customers also bought” is most common at 92%.
AI and Machine Learning in Personalization
Artificial intelligence powers modern personalization at scale. Adoption accelerates rapidly.
- Companies using AI for personalization: 68%
- AI personalization accuracy improvement: 45%
- Real-time personalization capability: 78%
- Predictive personalization adoption: 54%
68% of companies now use AI for personalization. AI improves personalization accuracy by 45% over rule-based systems.
AI personalization applications:
| Application | Adoption Rate | Effectiveness |
| Product recommendations | 82% | 9.2/10 |
| Content personalization | 64% | 8.6/10 |
| Predictive search | 48% | 8.4/10 |
| Dynamic pricing | 38% | 7.8/10 |
| Chatbot personalization | 72% | 7.4/10 |
| Email send time optimization | 56% | 8.8/10 |
AI-powered product recommendations achieve the highest effectiveness rating at 9.2/10.
Personalization by Industry
Different industries adopt personalization at varying rates and see different results.
Industry-Specific Adoption Rates
| Industry | Personalization Adoption | Avg. ROI | Primary Use Case |
| E-commerce/Retail | 94% | 320% | Product recommendations |
| Media/Entertainment | 88% | 280% | Content recommendations |
| Financial Services | 72% | 240% | Customized offers |
| Healthcare | 58% | 180% | Patient communications |
| Travel/Hospitality | 86% | 340% | Dynamic packages |
| SaaS/Technology | 82% | 290% | Product tours |
| Education | 64% | 220% | Course recommendations |
| Telecommunications | 68% | 210% | Plan optimization |
E-commerce leads adoption at 94%, while travel shows highest ROI at 340%.
Industry Success Stories
E-commerce:
- Amazon: 35% of revenue from recommendations
- Average implementation: 31% revenue from recommendations
Streaming Media:
- Netflix: 80% of watched content from recommendations
- Spotify: 31% of listening from personalized playlists
Travel:
- Booking.com: 40% conversion rate improvement
- Expedia: 25% increase in bookings
Privacy and Data Usage in Personalization
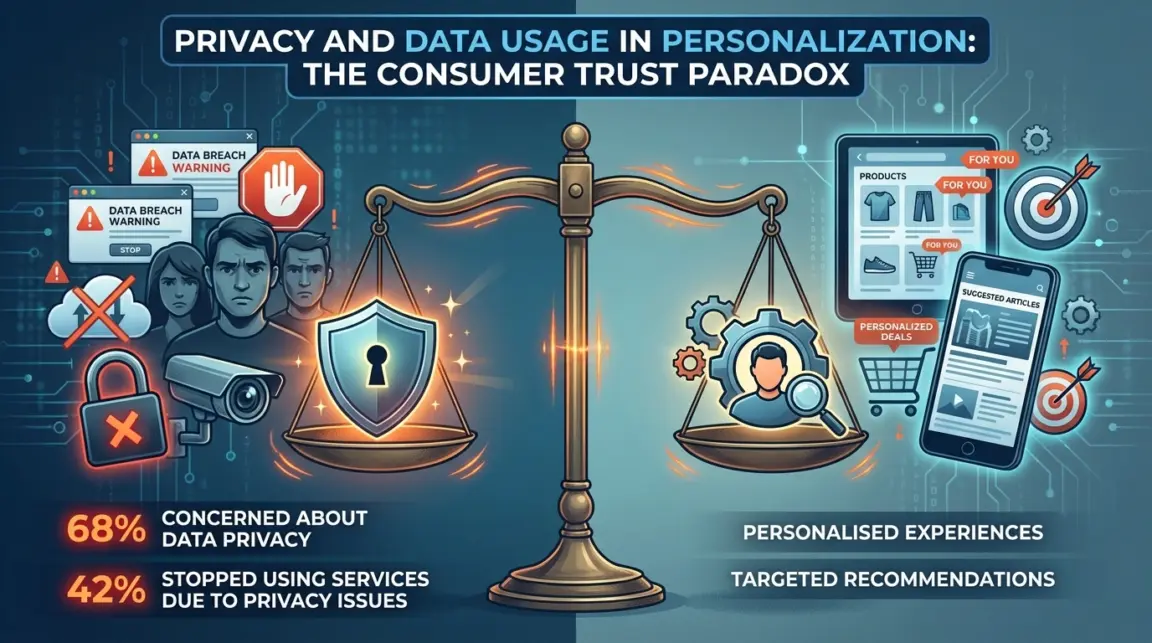
Consumers balance privacy concerns with personalization benefits. The tension shapes adoption.
- Consumers concerned about data privacy: 68%
- Consumers willing to share data for personalization: 63%
- Consumers who want transparency: 82%
- Consumers who’ve stopped using services due to privacy: 42%
68% of consumers worry about data privacy, yet 63% will share data if they get valuable personalization. Transparency is critical—82% demand it.
Data consumers will share for personalization:
| Data Type | Willing to Share | Primary Concern |
| Purchase history | 72% | Security |
| Browsing behavior | 58% | Tracking |
| Location data | 48% | Privacy |
| Personal demographics | 64% | Misuse |
| Social media activity | 32% | Oversharing |
| Health information | 28% | Sensitivity |
Consumers most readily share purchase history (72%) and demographics (64%). Health information (28%) and social media activity (32%) face strongest resistance.
GDPR and Privacy Regulation Impact
- Companies affected by privacy regulations: 78%
- Personalization strategies changed due to GDPR: 64%
- First-party data collection increase: 58%
- Third-party data usage decrease: 42%
Privacy regulations forced 64% of companies to modify personalization strategies. First-party data collection increased 58% as third-party cookies decline.
Personalization Technology and Tools
- Average number of personalization tools used: 3.8
- Annual spend on personalization software: $284,000 (average)
- Companies planning to increase personalization budgets: 72%
- Personalization staff per company: 6.4 people average
Companies use an average of 3.8 personalization tools and spend $284,000 annually on software.
Most used personalization technologies:
| Technology Type | Adoption Rate | Avg. Annual Cost |
| Email personalization | 92% | $18,000 |
| Web personalization platforms | 68% | $64,000 |
| Product recommendation engines | 78% | $42,000 |
| Customer data platforms | 58% | $128,000 |
| AI/ML personalization | 64% | $96,000 |
| Marketing automation | 84% | $48,000 |
Customer data platforms cost most at $128,000 annually but show only 58% adoption. Email tools are universal (92%) and affordable ($18,000).
Omnichannel Personalization Statistics
Consistent personalization across channels drives the strongest results.
- Companies with omnichannel personalization: 42%
- Revenue increase from omnichannel: 34% (vs. 20% single-channel)
- Customer retention improvement: 48%
- Cross-channel consistency importance: 86% of consumers
Only 42% of companies achieve true omnichannel personalization. These companies see 34% revenue increases versus 20% from single-channel efforts.
Omnichannel personalization challenges:
- Data integration across systems: 68%
- Real-time synchronization: 58%
- Maintaining consistency: 54%
- Technology costs: 48%
- Organizational silos: 62%
Data integration (68%) and organizational silos (62%) represent the biggest obstacles to omnichannel personalization.
Future Personalization Trends
Personalization continues evolving rapidly. Several trends will dominate 2026-2030.
- Hyper-personalization adoption (2030): 78%
- Voice-based personalization: 54% exploring
- AR/VR personalization: 32% developing
- Emotional AI personalization: 28% testing
Emerging personalization technologies:
- Real-time emotion detection: 28% interest
- Biometric personalization: 18% testing
- IoT-based personalization: 42% developing
- Blockchain for privacy-safe personalization: 24% exploring
Frequently Asked Questions
1. How many companies use personalization?
88% of companies implement some form of personalization as of 2026, up from 42% in 2017. E-commerce leads at 94% adoption, followed by media/entertainment (88%) and travel (86%). Only 12% of companies have no personalization strategy.
2. What ROI does personalization deliver?
Personalization delivers 20% average revenue increases with 89% of companies reporting positive ROI. E-commerce sees 31% of total revenue from product recommendations alone. Conversion rates improve 19% on average, while customer lifetime value increases 25%.
3. Do consumers actually want personalized experiences?
71% of consumers expect personalized experiences, and 76% feel frustrated when interactions aren’t personalized. 80% are more likely to purchase from brands offering personalization. However, 68% worry about privacy, creating tension companies must navigate carefully.
4. What’s the most effective type of personalization?
Product recommendations deliver the strongest results, driving 38% conversion increases and generating 31% of total e-commerce revenue. Behavioral targeting shows 42% revenue lift, while personalized emails achieve 26% higher open rates and 58% more revenue per email.
5. How much do companies spend on personalization?
Companies spend an average $284,000 annually on personalization software, using 3.8 different tools on average. Customer data platforms cost the most at $128,000 yearly, while email personalization averages just $18,000. 72% of companies plan budget increases.
Also Read:
- Blockchain Adoption Statistics
- Smartwatch Statistics
- TikTok User Statistics
- Labubu Statistics
- Social Media Statistics
Conclusion
Personalization has become a business necessity, with 88% adoption in 2026 and a market projected to grow at 26.3% annually, reaching $9.12 billion by 2030.
Consumer expectations are higher than ever, with 71% expecting personalized experiences and 80% more likely to purchase from brands that offer them.
Personalization drives significant revenue increases, with 20% higher revenue, 19% better conversions, and 25% improved customer lifetime value.
AI powers 68% of personalization efforts, improving accuracy by 45%. However, privacy concerns remain, with 63% of consumers willing to share data, but 68% worried about privacy. E-commerce leads in adoption, and travel shows the highest ROI.
Investment in personalization is rising, with companies spending $284,000 annually and 72% planning budget increases. Looking ahead, hyper-personalization, AI, and AR/VR will further reshape customer experiences, making personalization a key factor for business success.
Comments
Be the first to leave a comment.